---
title: Elm Wealth Research (4)
description: Regular Elm Posts (4)
---
[](http://elmwealth.com/)
Open main menu Close main menu
# Elm Wealth Research
Select Category Featured Insights How Elm Works In the News Investing 101 Risk and Return Tax Matters Uncategorized

[In the News](https://insights.elmwealth.com/elm-wealth-research/tag/in-the-news)
### [Victor a Guest on Bloomberg’s Trillions Podcast: The Road to Index Investing](https://insights.elmwealth.com/elm-wealth-research/victor-on-trillions)
Jun 1, 2021, 12:00:00 AM
June 1, 2021
In the News
## Victor a Guest on Bloomberg’s Trillions Podcast: The Road to Index Investing
Victor was recently a guest on Bloomberg’s *Trillions* podcast with Joel Weber and Eric Balchunas, discussing his long road from the trading desks at Salomon Brothers to LTCM to Elm’s inception and subsequent expansion.
You can also listen to the episode on [iTunes.](https://podcasts.apple.com/us/podcast/from-ltcm-to-etfs-victor-haghanis-long-road-to-index/id1318276878?i=1000523259300)
---
For more on the topics discussed in the episode:
- *[ETFs: Better Than Mutual Funds for Long Term Investors too?](https://elmwealth.com/etfs-better-than-mutual-funds-for-long-term-investors-too/)*
- *[Do Index Buyers Make Over-Valued Stocks More Over-Valued?](https://elmwealth.com/do-index-buyers-make-over-valued-stocks-more-over-valued/)*
- *[A Penny Saved is Two Pennies Earned](https://elmwealth.com/a-penny-saved-is-two-pennies-earned/)*
- *[Home Biased: A Case for More Indexing](https://elmwealth.com/home-biased-more-indexing/)*
- *[What’s all the Hoopla? Truly Passive Indexers are Still a Rare Breed](https://elmwealth.com/whats-all-the-hoopla-passive-indexers-are-still-a-rare-breed/)*
- *[Mind the Gap: Inequality and Diversification](https://elmwealth.com/mind-the-gap/)*
- *[How well do global market-cap weighted indexes represent the true ‘market portfolio’?](https://elmwealth.com/how-well-do-global-market-cap-weighted-indexes-represent-the-true-market-portfolio/)*
[James White](https://insights.elmwealth.com/elm-wealth-research/author/james-white)
[Read More](https://insights.elmwealth.com/elm-wealth-research/victor-on-trillions)

[Risk and Return](https://insights.elmwealth.com/elm-wealth-research/tag/risk-and-return)
### [We’re All HODLRs Now](https://insights.elmwealth.com/elm-wealth-research/were-all-holdrs-now)
Apr 27, 2021, 12:00:00 AM
April 27, 2021
Risk and Return
## We’re All HODLRs Now
*By Victor Haghani and James White* [1](https://insights.elmwealth.com/elm-wealth-research/page/4#easy-footnote-bottom-1-3893)
If you’ve been asking yourself the question: “To BTC, or not to BTC?” the market, in its infinite wisdom, may have just decided for you: we’re all HODLRs[2](https://insights.elmwealth.com/elm-wealth-research/page/4#easy-footnote-bottom-2-3893) now, whether you like it or not.[3](https://insights.elmwealth.com/elm-wealth-research/page/4#easy-footnote-bottom-3-3893)
In a recent Bloomberg [Odd Lots podcast](https://podcasts.apple.com/us/podcast/ex-jane-street-trader-whos-building-multi-billion-crypto/id1056200096?i=1000515303033.) interview with Joe Weisenthal and Tracy Alloway, Sam Bankman-Fried – 28-year old MIT grad, $10bb Crypto Whale and founder of FTX crypto exchange – explained a relatively new development in the relationship between Bitcoin and the stock market:
*“If you rewind to 2018, you wouldn’t be sure whether stocks and crypto were positively or negatively correlated…*\[Some\] *people thought Bitcoin is the flight-to-safety asset – when stocks crash people would turn to Bitcoin – but others said it was a risk-on asset…Summary…wasn’t totally clear. Then after March 2020,* \[when Bitcoin and the stock market were both down big in the first two weeks of the month\] *now we know the answer. It’s clear that – at least right now – people see crypto as something with huge upside potential and the sort of the thing that does well in risk-on markets, not risk-off markets. Because when you’ve got a lot of money to play around with and you’re looking for something to do with it, something with huge upside sounds really appealing and you’re willing to take the risk that it goes to zero – but when everything is crashing and you’ve lost all your money, a lot of people are going to put it into what they think is going to be safe. That’s why the correlation* \[between equities and crytpo-currencies\] *has become really robustly positive.”*
We took a look at the data, and they do support Bankman-Fried’s observations. From the start of 2018 until now, Bitcoin’s Equity Beta – the standard measure of the systematic, market risk of an individual stock – has been 1.0.[4](https://insights.elmwealth.com/elm-wealth-research/page/4#easy-footnote-bottom-4-3893) By contrast, in the early days of Bitcoin, from 2014 to the end of 2017, it was only 0.3, with extended periods when it behaved like a safe-haven asset, going up when the stock market was falling.[5](https://insights.elmwealth.com/elm-wealth-research/page/4#easy-footnote-bottom-5-3893) This was consistent with the popular “digital gold” view of Bitcoin – a protection against a meltdown of the Western financial system. Meanwhile, real, shiny gold exhibited an Equity Beta of -0.2 and 0.2 over the same two periods, and as you’d expect, generated a much lower return as well.
From a purely statistical perspective, the last three years of data is telling us that if we wake up a year from now – or a month from now, the way things have been going – and Bitcoin has quadrupled to $200,000, the odds would be heavily in your favor to guess that the stock market will have gone up in value too – although far less than fourfold. Similarly, if Bitcoin collapses to $2,000, it’s pretty likely – as a matter of statistical inference – that the stock market will be lower. This argument doesn’t depend on knowing the direction of causality (if any) between changes in the stock market and Bitcoin. In fact, our best guess of what’s going on is that both the stock market and Bitcoin are being driven by some common forces, rather than Bitcoin driving price action in the stock market or the other way around.
As Bitcoin has gotten bigger, more widely-held and more integrated into the global financial system, it has been behaving more and more like a stock – a big, techie, super-volatile stock – and likewise, some stocks have been acting a little more like crypto-currencies. Here’s Bankman-Fried in the same interview, this time on how stocks are starting to behave more like coins:
*“In the last year, equities have started to look more like crypto. You look at GameStop…There’s a word for it in crypto, it’s called a ‘shit-coin.’ The beautiful moment of this* \[was\] *when RobinHood banned the buying of GameStop…GameStop crashed…They stopped buying GameStop and they bought what is in retrospect the only possible answer to this question. They bought Dogecoin! As soon as GameStop started crashing, Dogecoin ten-x’d* \[went up tenfold\]. *Absolutely beautiful!”*
Depending on your outlook, there are varying implications of Bitcoin’s current incarnation as a risk-on asset.
- If you think the expected return on Bitcoin is close to that of the stock market, you may want a small holding – Bitcoin’s current size relative to the global equity market is about 1%, and the total digital coin market amounts to a bit under 2% – just as you would want to own all the stocks in the market portfolio. However, many investors, ourselves included, feel owning the global stock market through low cost, liquid index funds and ETFs provides sufficient diversified exposure to risk-on assets, and don’t feel the need to own all the other assets that don’t come with a global stock market index fund.
- If you think the expected return is significantly higher than that of the stock market, then a more substantial holding would be consistent with that view.
- However, if you think it has an expected return lower than that of the stock market, as would be typical of a safe-haven asset, then you probably don’t want to own any of it: with a Beta of close to 1, it’s not offering the risk-mitigation to warrant the lower return.[6](https://insights.elmwealth.com/elm-wealth-research/page/4#easy-footnote-bottom-6-3893) Even if you’re more worried about inflation than financial crisis risk, we suspect that owning a combination of inflation-protected Treasury bonds (TIPS), real estate and equities,[7](https://insights.elmwealth.com/elm-wealth-research/page/4#easy-footnote-bottom-7-3893) might be a better way to get the job done.
- Finally, for those who are outright bearish on Bitcoin and its brethren, the higher correlation between the stock market and Bitcoin might be the canary in the coal mine – a warning that we should not expect the stock market to be unconnected to swings in the crypto-currency markets. Thinking back to the buildup to the dot.com crisis and the subprime mortgage debacle, many market observers (your authors included) wrongly believed that the broad stock market would be minimally affected by a crash in these relatively small pockets of speculative fever, as each amounted to roughly 4% of global stock market capitalization.[8](https://insights.elmwealth.com/elm-wealth-research/page/4#easy-footnote-bottom-8-3893) Currently, Bitcoin, other digital coins and related businesses are about 3% of the size of the stock market.
While we agree with Sam Bankman-Fried that, currently, Bitcoin is mostly behaving like a risk-on, speculative asset, we also recognize that it has gone through many rebirths and transformations. In early November 2020, Odd Lots co-host Tracy Alloway made the most cogent case we’ve heard for why we should expect the Bitcoin narrative to continue evolving, which will force investors to reassess its place in the matrix of investment choices:
*“I have a confession to make: I am now bullish on Bitcoin. I’m bullish on Bitcoin because I’m bullish on cognitive dissonance in a complex society, and on people’s ability to produce endless narratives for cryptocurrency – even ones that are, at times, contradictory. Since its creation back in 2009, Bitcoin has been lauded and promoted as so many things. It’s a method of payment (you can buy pizza!) but it’s also a speculative financial asset whose value is destined to go up (so you should save it!). It’s a hedge against inflation (because central banks are printing money!) but it’s also a financial asset that benefits when interest rates are close to zero and there’s less opportunity cost to hold it (it’s digital gold!). Bitcoin is a way of disintermediating the existing financial system (because you can’t trust the bank!), but it’s also something that would benefit from a flood of institutional money (asset managers are diving in!).”*
---
1. This not is not an offer or solicitation to invest, nor should this be construed in any way as tax advice. **Past returns are not indicative of future performance.**
Thanks to Simon Bowden, Richard Dewey, Costas Kaplanis, John Karubian and Ricky Moezinia for their suggestions.
2. According to [Investopedia.com](https://www.investopedia.com/terms/h/hodl.asp#:~:text=HODL%20is%20sometimes%20explained%20as,dear%20life%22%20or%20some%20variation.):
*“HODL is a term derived from a misspelling of “hold” that refers to buy-and-hold strategies in the context of bitcoin and other crypto-currencies.”*
More recently, it’s been used as an acronym for “Hold On for Dear Life,” in recognition of the wild ride that most crypto-currency investors experience.
3. Not that you’ll find Bitcoin has magically appeared in your brokerage account, although for every $1,000,000 invested in the broad US stock market, you own over $100 of Bitcoin through your ownership of Tesla (TSLA), Microstrategy (MSTR) and Square (SQ), and another $2,000 or so in crypto-currency focused companies such as Coinbase (Coin).
4. Note that a Beta of 1.0 does not imply a correlation of 1.0. Highly volatile assets can have a high Beta with a low correlation. *βi = ρi,m σi / σm* , where *i* refers to the asset whose Beta we are measuring and *m* refers to the broad stock market.
5. Beta measured using weekly overlapping weekly returns for the S&P500 and Bitcoin from 9/30/2013 to 4/19/2021.
6. Another serious challenge to the notion of Bitcoin as a safe-haven asset is the fact that under most plausible assumptions, the combination of a low expected return, high volatility, and a conviction that its price cannot go below zero, results in a strong downward drift in the expected median value of Bitcoin over time.
For example, with Bitcoin’s 85% annual volatility and a 0% expected return, the median price of Bitcoin in four year’s time would be about 80% lower than today’s price. This effect is known as “volatility drag.”
7. For example, German equities actually increased in value in US dollars through the hyperinflation experienced from 1921 – 1923, while all nominal claims were essentially wiped out. See *“The Economics Of Inflation – A Study Of Currency Depreciation In Post War Germany”,* by Costantino Bresciani-Turroni, 2008.
8. Total loss of value in dot.com companies was estimated at $1.7 trillion, with stock market capitalization around $38 trillion [(Wikipedia: Dot-com bubble)](https://en.wikipedia.org/wiki/Dot-com_bubble). Subprime mortgage market at its peak was $1.3 trillion [(Wikipedia: Subprime crisis background information)](https://en.wikipedia.org/wiki/Subprime_crisis_background_information), and the global stock market was $40 trillion.
[James White](https://insights.elmwealth.com/elm-wealth-research/author/james-white)
[Read More](https://insights.elmwealth.com/elm-wealth-research/were-all-holdrs-now)

[Featured Insights](https://insights.elmwealth.com/elm-wealth-research/tag/featured-insights)
### [Spending Like You’ll Live Forever](https://insights.elmwealth.com/elm-wealth-research/spending-like-youll-live-forever)
Apr 6, 2021, 12:00:00 AM
April 6, 2021
Featured Insights
## Spending Like You’ll Live Forever
*By Victor Haghani and James White* [1](https://insights.elmwealth.com/elm-wealth-research/page/4#easy-footnote-bottom-1-3814)
### Introduction
Many of our readers are involved with various forms of endowments – their own Donor Advised Fund or Foundation, or charitable advisory boards they sit on. Families with wealth in excess of what they expect to spend in their lifetimes may also think of that surplus as an endowment to benefit future generations. Even for those with no connection to endowments, there are valuable lessons to be learned from the question of how one should invest and spend their resources when freed from the complications of taxes and human longevity.
Harvard Professor John Campbell defines an endowment as “a promise of vigorous immortality”. We think he means the endowment should be able to fulfill its mission indefinitely into the future: spending shouldn’t be so profligate that the capital will be exhausted in one generation, nor so miserly that nothing is accomplished and capital accumulation becomes an end in itself.[2](https://insights.elmwealth.com/elm-wealth-research/page/4#easy-footnote-bottom-2-3814) We’ll expand on this description of an endowment’s mission and explain the important and fascinating result that, under most reasonable sets of assumptions, it is optimal to spend substantially less than the expected real return of the endowment’s investment portfolio.
The challenges of choosing the best investment and spending policies are clearly connected. The conventional approach many endowments, especially large ones, have adopted is to invest like Yale and spend about 4% of the value of the endowment each year, a spending rate chosen so that there’s an arbitrarily low probability of spending falling below an arbitrarily chosen floor.[3](https://insights.elmwealth.com/elm-wealth-research/page/4#easy-footnote-bottom-3-3814) There are two problems with this orthodoxy, besides the double dose of arbitrariness: 1) the investing and spending choices are not part of a unified framework, even though in reality they are inexorably connected, and 2) neither policy is explicitly responsive to changes in the investing landscape.
It’s been over twenty years since the Yale investment model was introduced in David Swensen’s book, *Pioneering Portfolio Management: An Unconventional Approach to Institutional Investment*, which instantly became the de facto endowment operating manual. It was undoubtedly both pioneering and unconventional when Swensen implemented it at Yale in the late 1980s. However, over the past twenty years, there has been nothing short of a sea-change decline in interest rates and expected returns on risky assets. Since 1999, low-risk real interest rates have plummeted from +4% to current levels around -1%. Alternative asset classes can’t make up for the decline in the expected returns offered by public markets, as they are no longer the high-return niche they used to be. Unfortunately, there is little in Swensen’s book that addresses how an endowment’s investing and spending policies should react to such dramatic changes in investment opportunities as we’ve experienced.
Ironically, nestled right inside the universities with some of the largest endowments, finance professors such as Robert Merton (MIT/Harvard) and John Campbell (Yale/Harvard) have developed valuable insights and tools which explicitly take account of changing environments and opportunities. Sadly, these ideas seem not to have made it into the mainstream of endowment practice, a state of affairs we hope this note will help to redress.
We’ve developed some web-based tools you can use to further explore many of the concepts found throughout this note. One is naturally focused on non-taxable endowments, the other on taxable individual investors:
**[Endowment Investing and Spending Calculator](https://elmwealth.com/endowment-calculator/)**
**[Individual Investing and Spending Calculator](https://elmwealth.com/portfolio-choice2/)**
### Three Spending Policy Options
It’s easiest to get an appreciation for the problem of choosing a long-horizon spending policy by taking the investment policy as already being chosen. Let’s evaluate three possible annual spending policies, given an investment environment and endowment asset allocation as described in Table 1. We’ll put to the side for now the role future contributions play on both spending and investment policy (see Appendix). Throughout, we’ll work in inflation-adjusted terms.
| Table 1: Investment Environment and Policy Assumptions | |
| --- | --- |
| Long-term risk-free real rate | 0% |
| Expected real return on a well-chosen mix of public and private market risky assets[4](https://insights.elmwealth.com/elm-wealth-research/page/4#easy-footnote-bottom-4-3814) | 6.0% |
| Risky Assets Annual Volatility of Returns | 16% |
| Endowment asset allocation | 85% in risk-assets 15% in risk-free assets |
| Endowment Expected Return | 5.1%[5](https://insights.elmwealth.com/elm-wealth-research/page/4#easy-footnote-bottom-5-3814) |
### Policy 1: Spend a Fixed Annual Sum Equal to the Expected Simple Return of the Portfolio
The expected real return on the endowment’s portfolio, as per Table 1, is 5.1% per annum. Let’s first consider a policy of spending a fixed, but inflation-adjusted, $5.10 each year, assuming a starting value of the portfolio of $100. The endowment can get into trouble if its value drops but it keeps on making $5.10 payments each year. And if it experiences excellent returns, then the endowment will get very big and the $5.10 it will be spending each year will seem too meager. Chart 1 shows the median[6](https://insights.elmwealth.com/elm-wealth-research/page/4#easy-footnote-bottom-6-3814) spending and average spending over time. In the early years, it’s very likely the endowment will have enough assets to meet the $5.10 spending policy, but in about 35 years, there’s a roughly 50% chance that the endowment will have run out of money, and so median spending drops to zero. The average or expected spend also drops over time, although not as dramatically as the median spending amount.
It’s unlikely any endowment is intentionally following this kind of fixed dollar spending policy – however, in personal financial planning, the most prominent spending rule does take exactly this form. It is known as the ‘4% rule,’ and it advises retirees to calculate 4% of their savings at retirement, and spend that inflation-adjusted dollar sum every year (and hope they won’t go broke). We include this as our first rule because it so clearly illustrates the close connection between spending risk and investment risk in the long term.
*Chart 1: Spending $5.10 a Year (starting endowment value = $100)*
### Policy 2: Spend a Fixed Annual Percentage of the Endowment Value Equal to the Expected Simple Return of the Portfolio
The second policy we’ll consider is to spend the expected real simple return of the portfolio each year. From Table 1 that means spending 5.1% per year, and in fact this is close to Yale’s actual spending target policy of 5.25% over the past decade.[7](https://insights.elmwealth.com/elm-wealth-research/page/4#easy-footnote-bottom-7-3814)
Chart 2 uses a heatmap to show the probability of falling below a given level of spending, with the lightest color signifying 100% probability. Under this policy, it may come as an unpleasant surprise that median real spending falls by about 40% over 50 years, and by 2/3rds over 100 years. The median endowment value also falls by these amounts, since the spending rule is a fixed percentage of endowment value. We suspect most endowments would find this profile unattractive. The cause of this problem is often referred to as “volatility drag”, and relates to how volatility in returns makes the median return always lower than the average return.[8](https://insights.elmwealth.com/elm-wealth-research/page/4#easy-footnote-bottom-8-3814) Following a spending policy equal to the expected portfolio return will keep the *average* spending amount and the *average* portfolio value constant, but this average is heavily influenced by a very small probability of extremely good outcomes. The median outcome, which is the most likely outcome, will always be lower, and if the average outcome is constant over time the median must be falling, as we see here.
*Chart 2: Spending 5.1% a year*
### Policy 3: Spend a Fixed Annual Percentage of the Endowment Value Equal to the Expected Compound Return of the Portfolio
This brings us to the third spending policy, which is to spend the expected *compound* real return of the portfolio. With the assumptions from Table 1 it is 4.2% per annum.[9](https://insights.elmwealth.com/elm-wealth-research/page/4#easy-footnote-bottom-9-3814) This happens to match the average spending rate across all US college and university endowments.
We can see in the chart below that now median spending stays constant over time, while average spending drifts higher. Early thinking about endowment spending, such as that of Nobel laureate James Tobin (1974), viewed the previous rule, spending the expected simple return of the portfolio, as the ‘Sustainable Spending Rate’ that endowments should adopt.[10](https://insights.elmwealth.com/elm-wealth-research/page/4#easy-footnote-bottom-10-3814) More recently, however, the consensus has shifted to viewing this third rule as a better definition of Sustainable Spending because it keeps median spending and median endowment value constant over time, and medians accord better with what we are “likely” to experience.[11](https://insights.elmwealth.com/elm-wealth-research/page/4#easy-footnote-bottom-11-3814)
*Chart 3: Spending 4.2% a year*
### How to Compare Different Spending Policies
For many endowment trustees, they may find the third policy more attractive than the first two…but is it the optimal choice? We can see from the charts that Rule 3 produces the highest total median and average dollar spending over the horizon – because spending less in early years allows more growth to fund higher spending later on – but does that make it the best policy? It would be a pretty tall order to identify the best spending policy just by eyeballing the differences between colorful heatmaps. Focusing on medians rather than averages seems reasonable, but it’s a value judgement to which we haven’t yet given a particularly rigorous foundation.
We need a more powerful summary statistic for comparing different spending rules. Such a metric should take account of:
- The level of spending – more is better than less.
- The smoothness of spending over time – consistent spending is better than volatile spending.
- The immediacy of spending – sooner is better than later.
The standard metric which economists use which neatly incorporates all of these criteria in evaluating an uncertain stream of spending over time is Discounted Expected Utility of Spending.
### Utility
In order to use this metric, we need to uncover the endowment’s Utility function. This is not as difficult an undertaking as it may seem. First, it has been observed that the amount of risk endowments take does not seem to vary much over a wide range of endowment sizes, which allows us to reasonably use a form of utility called Constant Relative Risk-Aversion (CRRA) Utility. This type of Utility function has only one parameter, which is the degree of risk-aversion.[12](https://insights.elmwealth.com/elm-wealth-research/page/4#easy-footnote-bottom-12-3814) For a particular endowment, its risk-aversion can be deduced from the investment policy it has chosen, if we know the estimates of expected return and risk on which it based its portfolio choice.[13](https://insights.elmwealth.com/elm-wealth-research/page/4#easy-footnote-bottom-13-3814) Given the investment environment described in Table 1, the endowment’s level of risk-aversion implied by its chosen portfolio is a fairly normal level exhibited by wealthy, financially sophisticated individuals.[14](https://insights.elmwealth.com/elm-wealth-research/page/4#easy-footnote-bottom-14-3814)
### Time Preference: Weighing a Better Present Against a Better Future
With the endowment’s utility function and the distribution of portfolio returns in hand, we can calculate the Expected Utility of Spending for any spending policy – but to calculate the Discounted Expected Utility, we need to know how the endowment discounts current versus future benefits of spending, that is, the endowment’s “Time Preference.” Economists and philosophers have long noted the general human preference for good things to happen to us sooner rather than later, but does that apply to an endowment too? James Tobin thought that endowments should have zero time preference, stating: [15](https://insights.elmwealth.com/elm-wealth-research/page/4#easy-footnote-bottom-15-3814)
*“The trustees of an endowed institution are the guardians of the future against the claims of the present. Their task is to preserve equity among generations…In formal terms, the trustees are supposed to have a zero subjective rate of time preference.”*
With respect to Professor Tobin’s view, we wonder if it is plausible or advisable for any social entity – endowment, foundation, family or individual – to exhibit zero time preference. Is it reasonable that an endowment would put an equal value on the social welfare arising from $1 today as it would on the same amount of welfare generated in 1,000 years? Indeed, there are good reasons why it would be rational for endowments to express some degree of time preference, such as a belief that making the world better today will pay dividends in making the world even better in the future, and acknowledging the truth that while endowments expect to exist for a very long time, that’s not the same as forever.[16](https://insights.elmwealth.com/elm-wealth-research/page/4#easy-footnote-bottom-16-3814)
How can we help an endowment calibrate its time preference? One suggestion is for the endowment trustees to contemplate how much they would spend if their only investment option were a risk-free asset paying a 0% real return each year. Any spending in this case would run down the endowment value, and the choice of how fast determines the endowment’s time preference.
The U.S. federal government suggests cost-benefit analysis of social programs use a real “social rate of time preference” of 3%.[17](https://insights.elmwealth.com/elm-wealth-research/page/4#easy-footnote-bottom-17-3814) Another data point that garnered much attention was the U.K.’s Stern report on the economics of climate change (2006) which more controversially used a rate of time preference of 0.1% for weighing costs and benefits occurring over many years. We will use a rate of time preference of 2% for the Base Case analysis that follows.[18](https://insights.elmwealth.com/elm-wealth-research/page/4#easy-footnote-bottom-18-3814)
### Put Your Faith in DEUS: Discounted Expected Utility of Spending
An endowment should prefer one spending policy over another if it generates higher Discounted Expected Utility of Spending (DEUS). In the table below, we compare the three spending rules we’ve already discussed against each other using this metric. What we show for each rule is how many dollars the endowment would need to start with so that it would generate the same amount of DEUS under each spending rule over a one hundred year horizon. We’ve assumed a time preference of 2% per annum, and risk-aversion consistent with risk and return numbers in Table 1. Notice that the endowment would need considerably more assets to start with under rules 1 and 2 to generate the same expected welfare as under rule 3.[19](https://insights.elmwealth.com/elm-wealth-research/page/4#easy-footnote-bottom-19-3814) The endowment’s choice of spending policy matters a lot.
| Comparing Spending Rules: Size of Endowment Needed to Generate Equal Welfare Over 100 Years Under Different Spending Policies | | |
| --- | --- | --- |
| Rule 1 Spend $5.10 pa | Rule 2 Spend 5.1% of Endowment pa | Rule 3 Spend 4.2% of Endowment pa |
| $184 | $151 | $100 |
### In Search of the Optimal Spending Policy
If we can compare the DEUS for different spending policies we propose, it begs the question: can we find an optimal spending rule? Remarkably, the answer is yes.[20](https://insights.elmwealth.com/elm-wealth-research/page/4#easy-footnote-bottom-20-3814) Robert Merton found it, and shared it in his first published economics article in 1969, marking the start of one of the most prolific and creative careers in financial economics.[21](https://insights.elmwealth.com/elm-wealth-research/page/4#easy-footnote-bottom-21-3814) In fact, Merton did more than solve for the optimal spending rule: he solved for the joint optimal spending rule and optimal investment policy.
Three variables feed into the optimal amount of risk to take, known as the “Merton Share”:
1. The expected return of the risky portfolio in excess of the risk-free rate. Higher excess returns imply a higher optimal risk setting.
2. The variability of the risky portfolio measured by its variance.[22](https://insights.elmwealth.com/elm-wealth-research/page/4#easy-footnote-bottom-22-3814) Higher variance implies lower optimal risk-taking, all else being equal.
3. The risk aversion coefficient – higher risk aversion implies lower optimal risk.
For the optimal spending rule, Merton shows that it must be a proportional rule, spending a fixed fraction of the portfolio each period. This optimal spending fraction is also a function of three inputs:
1. The “risk-adjusted” return, also known as the Certainty-Equivalent return of the total portfolio when invested at the optimal risk level. This is the certain return one would accept in lieu of the risky portfolio’s return. Higher risk-adjusted returns allow for higher spending rates, but generally not on a one-for-one basis.
2. The time preference rate. Higher time preference increases the optimal spending rate.
3. The level of risk aversion. If time preference is lower than the portfolio’s risk-adjusted return (as in our Base Case), then higher risk aversion increases the optimal spending rate, and vice versa.
Merton Optimal Investment and Spending Formulas for an Endowment with Infinite Life
k\* = μ – r γσ2
where *k\** is optimal exposure to the risky asset
*μ* is the expected return on the risky asset
*r* is the return on the safe asset
*σ* is the annual standard deviation of returns of the risky asset
*γ* is the coefficient of CRRA risk aversion
C\* = rce – rce – rtp γ
where *C\** is the optimal spending rate[23](https://insights.elmwealth.com/elm-wealth-research/page/4#easy-footnote-bottom-23-3814)
*rce* is the certainty equivalent return of the optimal portfolio
rce = r + k\* 2 (μ – r) *rtp* is the investor’s time preference of spending
### Where Merton Meets the Road
Knowing the optimal rule to follow is great, but does it deliver much real improvement over Rule 3, the “Sustainable Spending” policy? Staying with the same set of assumptions, Merton’s optimal spending policy would be to spend 2.4% of the value of the endowment each year. An endowment following the Sustainable Spending policy for 100 years, spending 4.2% per year, would need about 33% more in starting assets in order to deliver the same discounted expected utility from following the Merton-optimal rule, and the gap gets bigger as we look at longer horizons. The simplicity of the Sustainable Spending Rule is attractive, but it does not directly take account of the endowment’s risk aversion or time preference, and so in general it will lead to suboptimal spending decisions.
The chart below shows the average and median spending under the two spending policies (Sustainable and Optimal). It is difficult to visually decide which spending policy is more attractive without having a comprehensive metric that takes account of the main contours of the endowment’s preferences over uncertainty and time.
*Chart 4: Comparing Merton Optimal vs. Sustainable Spending Rules*
There are some preference sets for which the Sustainable Spending rule is quite close to Merton’s optimal spending rule, and others for which it’s even further away than the base case we examine. In our example from Table 1, if the endowment exhibited time preference equal to 7% per year, then Merton’s optimal spending policy would be to spend 4.2% per year, the same as the Sustainable Spending policy. On the other hand, if the endowment had zero time preference the Merton-optimal spending rate would be much lower, at just 1.6%.
### Conclusion
The Merton model and its extended family of descendants do not appear to play a central role in shaping the investment and spending policies of major endowments, foundations or other long-lived pools of capital. For example, in David Swensen’s already-mentioned endowment bible, there is no mention of Merton or the cohort of researchers, notably John Campbell, who have extended his work. Swensen’s only mention of Merton is to dismiss his formulation of the problem:
*“Economists might suggest that a utility function be employed to identify the appropriate asset allocation. Since few market participants would have any idea how to specify such a function, this technique proves remarkably unhelpful.”*
We found several other influential books on endowment and foundation investing equally silent on Merton’s formulation and solution of the problem.[24](https://insights.elmwealth.com/elm-wealth-research/page/4#easy-footnote-bottom-24-3814)
We don’t agree with Swensen’s criticism that the expected utility framework is too abstract to be useful in guiding, and linking, an endowment’s investment and spending policies. For example, in a survey we conducted two years ago and reported in [Measuring the Fabric of Felicity](https://elmwealth.com/measuring-the-fabric-of-felicity/), we found that a sample of financial professionals were comfortable calibrating personal utility functions. In addition, we found that their preferences were consistent with Constant Relative Risk Aversion, the form of utility function underlying the Merton formulation described in this note. Since Merton’s 1969 paper, researchers have extended the model to make it more realistic in many dimensions, and we discuss a partial list of these extensions in the Appendix.
Unlike endowments, individuals are afflicted with tedious burdens like taxes, finite and variable longevity and an uncertain posterity. These factors make finding optimal rules somewhat more complex, and change the details in various ways, but the core principles stay the same:
- risk aversion and time-preference matter
- risk-taking should be proportional to excess expected returns and inversely proportional to variance
- spending should follow a proportional rule and be linked to risk-adjusted return
- investment risk and spending risk are inseparable
We intend to discuss the more complex case of the individual investor in a follow-up note.
Much has changed in the 30-plus years since Swensen arrived at the Yale endowment, and in the 50 years since Merton’s original solution to the endowment investing and spending policy problem. Markets can go through a number of radically different investing environments over the life of any single individual, and even moreso in the case an endowment. For stewards of long-term capital, we think the Merton framework and its extensions provide valuable guidance on navigating these changing waters.
---
### Appendix: Extensions
While Merton’s 1969 analysis gave us two simple formulas for the optimal spending and investing policy, it was under a stylized and restrictive set of assumptions. However, his formulation of the problem with the objective of maximizing Discounted Expected Utility of Spending is versatile and leads to solutions under a wide array of more realistic assumptions, many of which he provided in subsequent papers.
- The original Merton 1969 formulation was for a two-asset case, but later versions explicitly handle multiple assets. The two-asset case can be used where the risky asset can be considered the optimal portfolio of risky assets. The model handles any choice of risk-free asset, from Treasury Bills to inflation-indexed bonds.
- Although the original 1969 model assumed a constant risk-free rate and a risky asset that followed a random walk with constant expected return and variability, these assumptions can be relaxed. If the risk-free rate and expected excess return of the risky asset themselves follow independent random walks, the results remain substantially the same.
- In another important extension, Merton coined the term ‘hedging demand’ to describe the result that investors should want to own extra amounts of the risky asset if its expected return tends to go up when the price of the asset goes down, and vice versa.
- While we have focused on preferences characterized by Constant Relative Risk Aversion, solutions can be found for any concave and smooth utility functions, including ones that separate relative risk aversion from the elasticity of intertemporal substitution of consumption.[25](https://insights.elmwealth.com/elm-wealth-research/page/4#easy-footnote-bottom-25-3814)
- Parameter uncertainty leads investors to take less risk than would be optimal based on the point estimate of investment attractiveness. Similarly, learning also leads to conservatism, having the opposite effect as mean-reversion, and generates negative hedging demand.
- Spending policies, such as ‘sustainable spending’ or smoothed spending, can be exogenously specified and then an optimal investment policy given that spending policy can be solved for. John Y. Campbell and Roman Sigalov of Harvard have solved such a model, which suggests that as expected investment returns fall, the optimal endowment investment policy is to take more risk, a phenomenon known as ‘reaching for yield.’
### Family Wealth
Taxes on income, capital gains and inheritance result in significantly lower expected returns for private taxable wealth than that experienced by non-taxable endowments or foundations. As a result, optimal spending policies for large pools of private capital will be substantially lower than optimal spending policies for tax-exempt entities, assuming similar degrees of risk-aversion and time preference that we used for our typical endowment. With the investment environment assumptions from Table 1, but with a flat 30% tax on returns, 0% inheritance tax and assuming inflation of 2%, the Merton optimal spending policy for an endowment-like taxable pool of capital would be lower than that for a non-taxable endowment at about 1.5% per annum.
For families who ascribe similar utility to the consumption of future generations, the optimal spending rate would be lower than that of an endowment to take account of the expected growth in the size of the pool of future beneficiaries. For individuals whose savings will be primarily used during their retirement, the Merton optimal spending rule for the infinite horizon can be used to annuitize wealth to a finite horizon. We will discuss this in more detail in an upcoming note that focuses on individuals.
### Other Popular Spending Policies
Probably the first long-term spending policy that occurs to most investors is to spend the interest and dividend income they receive on their portfolio, which they hope will leave the earning power of their portfolio constant over time. Currently, for a portfolio 85% invested in global equities and 15% in US inflation-linked bonds, the resulting policy would be to spend 1.4% per year. While the simplicity of this rule is admirable, it is unlikely to be optimal except by coincidence as it does not explicitly take account of the risk or time preference of the investor, and its connection with the expected return of the portfolio is weak due to changes in company dividend policy over time. And of course, a dividend-based rule is not much help for investors who allocate heavily to alternative investments which have distribution policies that are arbitrary and rarely adjusted for inflation. A variant of this rule uses the Cyclically Adjusted Earnings Yield in place of the dividend yield of equities. The problem with this policy is that earnings yield is an estimate of the expected real return of the equity market, and as we’ve seen already, spending the expected return of the portfolio (see spending Rule 2 in the body of the note) is unlikely to be optimal.[26](https://insights.elmwealth.com/elm-wealth-research/page/4#easy-footnote-bottom-26-3814)
Many endowments apply a percentage spending rule on a smoothed basis. For example, the Yale endowment states:
*Spending in a given year sums to 80% of the previous year’s spending and 20% of the targeted long-term spending rate applied to the market value at the start of the prior year. The spending amount determined by the formula is adjusted for inflation and an allowance for taxes, subject to the constraint that the calculated rate is at least 4.0% and not more than 6.5% of the Endowment’s inflation-adjusted market value at the start of the prior year.*
Smoothed spending policies pick up the problem of fixed dollar policies, which can result in the endowment running out of money surprisingly quickly.
### Endowment Growth Through Ongoing Contributions
Endowments usually expect to receive further donations over time, and this can be integrated into the model for the optimal investment and spending policy. For example, Yale’s endowment has received annual donations of 2% to 2.5% of the value of the endowment over the past decade. However, many donors want their contributions to have long-term impact, and don’t expect them to form part of the annual operating budget. These, and related considerations such as the risk characteristics of the flow of donations over time, have been addressed and modeled by Robert Merton (1991) and others. Foundations and wealthy families can usually think about spending policies without this complication.
### For Investors Expecting Higher Returns Than Implied by Their Risk Taking
Some investors may expect much higher returns than are reflected in their portfolio choice, possibly as a response to an aversion to leverage. For example, if an endowment expected a 10% return on a well-chosen portfolio of risky assets with 15% risk, the optimal allocation to those risky investments would be 160% with the level of risk aversion we’ve been using. But let’s say the endowment decides to allocate just 85% to this attractive mix of investments. What is the optimal spending policy the endowment should pursue in this case? We can still use the Merton spending rule as expressed, but we need to define the risk-adjusted return on the portfolio more generally as:
*rce = r + k(μ – r) – γ k2 σ2 / 2*
where *k* is the actual allocation to the risky part of the portfolio, and not necessarily the optimal Merton Share allocation
Using this higher risk-adjusted return based on expected risky asset returns of 10% as an input to the Merton rule for optimal spending, but assuming an allocation of just 85% to the risky assets, produces a spending policy of 4.7% as compared to an optimal spending policy of 2.4% if the expected return on risky assets were 6%. Remarkably, the optimal spending percent would only increase from 4.7% to 5.9% if the endowment allocated 160% of its capital to the risky assets, making use of leverage. The relatively small uplift to spending rate doesn’t seem worth the 75% increase in exposure to risky assets, making it understandable why an endowment might choose less than the optimal amount of risk. As is usually the case with decisions based on optimizations, the marginal benefits decline as the optimal point is approached, so investors should focus on getting in the general vicinity of optimality and not be too fixated on getting to the exact optimal point.
---
### Further Reading and References
- Acharya, Shanta and Elroy Dimson. *Endowment Asset Management: Investment Strategies in Oxford and Cambridge.* Oxford University Press. 2007.
- Annable, Vince. *The Household Endowment Model : Wealth Planning for Affluent Families.* Wealth Strategies Advisory Group. 2019.
- Baumeister, Roy, George Loewenstein and Daniel Read. *Time and Decision: Economic and Psychological Perspectives of Intertemporal Choice.”* Russell Sage Foundation. 2003.
- Benzel, Rick and James E. Demmert. *The Sustainable Endowment.* New Insights Press. 2019.
- Black, Fischer. *“The Investment Policy Spectrum: Individuals, Endowment Funds and Pension Funds.”* Financial Analysts Journal. 1976.
- Campbell, John, Y. and Luis M. Viceira. *Strategic Asset Allocation.* Oxford University Press, (2002).
- Campbell, John, Y. and Roman Sigalov. [*“Portfolio Choice with Sustainable Spending: A Model of Reaching for Yield.”*](https://www.nber.org/system/files/working_papers/w27025/w27025.pdf) NBER. 2020.
- Campbell, John, Y. [*“Investing and Spending: The Twin Challenges of University Endowment Management.”*](https://scholar.harvard.edu/campbell/presentations/investing-and-spending-twin-challenges-university-endowment-management-forum-) Forum Futures. 2012.
- Dybvig, Philip H. [*“Dusenberry’s Ratcheting of Consumption: Optimal Dynamic Consumption and Investment Given Intolerance for Any Decline in Standard of Living.”*](https://www.jstor.org/stable/2297806?seq=1) Review of Economic Studies. 1995.
- Dybvig, Philip H. and Zhenjiang Qin. *“How to Squander Your Endowment: Pitfalls and Remedies.”* Washington University in St. Louis and University of Macao. Unpublished paper, 2019.
- Ennis, Richard and J. Peter Williamson. *“Spending Policy for Educational Endowments.”* The Common Fund Publications. 1976.
- Ford Foundation Advisory Committee on Endowment Management. *“Managing Educational Endowments: Report to the Ford Foundation.”* Ford Foundation. 1969.
- Goetzmann and Swensen. [*Yale Endowment Management Course description.*](https://viking.som.yale.edu/mgt-827-endowment-management/)
- Grinold, Richard, David Hopkins, and William Massy. *“A Model for Long-Range University Budget Planning Under Uncertainty.”* Bell Journal of Economics. 1978.
- Hindy, Ayman and Chi-fu Huang. *“On Intertemporal Preferences With a Continuous Time Dimension II: The Case of Uncertainty.”* MIT. 1989.
- Kochard, Lawrence E. and Cathleen M. Rittereiser. *Foundation and Endowment Investing: Philosophies and Strategies of Top Investors and Institutions.* Wiley. 2008.
- Merton, Robert, C. *“Lifetime Portfolio Selection under Uncertainty: The Continuous-Time Case.”* The Review of Economics and Statistics. Aug 1969.
- , *“Optimum consumption and portfolio rules in a continuous-time model.”* Journal of Economic Theory. 1971.
- , *Continuous-Time Finance.* Oxford. 1990.
- , [*“Optimal Investment Strategies for University Endowment Funds.”*](https://www.nber.org/papers/w3820) NBER. 1991.
- Orr, Leanna. [*“David Swensen Is Great for Yale. Is He Horrible for Investing? How the Yale Model ate endowments — and everything else.”*](https://www.institutionalinvestor.com/article/b1gj523tmfl2tt/David-Swensen-Is-Great-for-Yale-Is-He-Horrible-for-Investing) Institutional Investor. July 2019.
- Swensen, David, F. *Pioneering Portfolio Management: An Unconventional Approach to Institutional Investment.* Free Press. 2000.
- Tobin, James. *“What is Permanent Endowment Income?”* American Economic Review. Vol. 2, No. 64, 427-432. 1974.
- Yale Investment Office. [*Spending Policy, 2019 Update.*](https://static1.squarespace.com/static/55db7b87e4b0dca22fba2438/t/5ebbf53c4b59573668cd85cf/1589376317984/2019+Yale+Endowment.pdf) p24. 2019.
---
1. This not is not an offer or solicitation to invest, nor should this be construed in any way as tax advice. **Past returns are not indicative of future performance.**
We are very grateful for the help of Jamil Baz, Larry Hilibrand, Ayman Hindy, Chi-fu Huang, Antti Ilmanen, Andy Morton, Vlad Ragulin, Jeffrey Rosenbluth, Eric Rosenfeld and Scott Wilson. All errors are our own.
2. Campbell (2012).
3. 2019 NACUBO-TIAA Study of Endowments, 2010-2019 spending. [Here.](https://www.nacubo.org/Research/2020/Public-NTSE-Tables) US College and University Endowments and related foundations. Yale spends about 5.25%.
4. This expected return is expressed as an arithmetic pa expected return. We assume the returns of the portfolio of risky assets follow a random walk.
5. *5.1% = 85% x 6% + 15% x 0%*
6. The median value of spending is the outcome that defines the middle of the distribution, and is often useful to think about separate from the average outcome because the median is less heavily influenced by extreme outliers. For a time series of returns with volatility, the median return will always be lower than the average return.
7. As we’ll discuss later, Yale’s spending policy makes use of smoothing and also collars of 6.5% and 4%, which in effect makes its spending rule something of a hybrid between a percentage rule and fixed dollar rule.
8. An example illustrates this effect. Let’s say that each year, there’s a 50/50 chance that the endowment’s portfolio either increases in value by 18% or decreases in value by 8%. The average of +18% and -8% is the 5% average return of the endowment’s portfolio, with a bit of rounding. But, if the endowment goes up by 18% the first year, and then declines by 8% the second, or the other way around, the value of the portfolio will have returned only 4.2% per annum, 0.8% lower than the 5% expected annual return. This 4.2% return is the compound (or median or geometric average) return of the portfolio, while 5% is the expected arithmetic return of the portfolio.
9. Also known as the geometric average return.
10. *“…The trustees of an endowed university like my own (Yale) assume the institution to be immortal. They want to know, therefore, the rate of consumption from endowment which can be sustained indefinitely. Sustainable consumption is their conception of permanent endowment income…Consuming endowment income so defined means in principle that the existing endowment can continue to support the same set of activities that it is now supporting.”*
11. Dybvig and Qin, *“How to Squander Your Endowment,”* 2019, and Campbell and Sigalov, *“Portfolio Choice with Sustainable Spending: A Model of Reaching for Yield,”* 2020.
12. CRRA Utility takes the form: *U(C) = (1 – C(1 – γ)) / (γ – 1)* , where *C* is spending and *γ* is the coefficient of risk aversion.
13. Alternatively, for an endowment wishing to decide on an investment policy, there is a very reasonable range of CRRA risk-aversion levels which can serve as a useful starting point without requiring a complicated, idiosyncratic calibration exercise.
14. Equal to 2.75 times the risk-aversion of a typical Las Vegas professional, card-counting gambler trying to maximize the growth rate of his bankroll. It’s a level of risk-aversion that would make an investor ambivalent about accepting a gamble with a 50% chance of making 25% versus a 50% chance of losing 15%. See our note, [The Fabric of Felicity.](https://elmwealth.com/measuring-the-fabric-of-felicity/)
15. In the 1974 article already cited, and referenced by David Swensen in describing the Yale endowment’s spending policy choice.
16. If the endowment truly had zero time-preference, then in a world in which the only investment available to an endowment were a risk-free asset that paid a 0% real return above inflation, it would be optimal for the endowment to spend zero, thereby preserving the real value of the endowment forever. Another reductio ad absurdum argument observes that an endowment that had no time preference and expected to live forever would be willing to pay an infinite price for a perpetual, risk-free bond that offered a positive real yield. While we present this scenario as a thought-experiment, it is not as far-fetched as it used to be.
17. See [OMB Circular A-4](https://obamawhitehouse.archives.gov/omb/circulars_a004_a-4/) and [OMB Circular A-94.](https://www.whitehouse.gov/sites/whitehouse.gov/files/omb/circulars/A94/a094.pdf)
18. Time preference is equal to the desired spending rate in the zero return scenario multiplied by the coefficient of risk-aversion of the endowment, which we’ve assumed is equal to 2.75 in the Base Case. So, if the trustees felt that they would spend 0.75% of the endowment each year in a zero return environment, time preference would equal 2% pa.
19. These results are sensitive to choice of time preference, but robust within a reasonable range of choices. For example, with time preference of 0% , rules 1 and 2 would need to start with capital of $184 and $168, and with time preference of 4%, rules 1 and 2 would need to start with $183 and $131 to generate the same discounted expected utility of spending over 100 years as rule 3.
20. Given a set of assumptions that asset prices are well-behaved and investors exhibit Constant Relative Risk Aversion.
21. Of course, others also deserve credit for contributing to these insights, including Paul Samuelson, Merton’s mentor and collaborator, and Franco Modigliani, who was awarded a Nobel prize for his pioneering contributions to the field of life-cycle financial decision-making.
22. 22 Variance is equal to Standard Deviation squared.
23. Merton’s formula for optimal consumption can be arrived at by observing that a consumption policy is optimal only if all along its path the marginal utility of $1 not consumed at a point in time is equal to the marginal benefit of that $1 plus its growth at a later time, adjusted for time preference. This can be expressed as: *U'(Ct) = U'(Ct + dt) \* e(rce – rtp)dt* . This simplifies to: *ln((Ct + dt) / Ct) = (rce – rtp) / γ* . As *ln((Ct + dt) / Ct)* is the growth in optimal consumption, and *rce* is the growth in the portfolio, then optimal consumption, *C\* = rce – (rce – rtp) / γ* . This is Merton’s formula for consumption, *C\** .
24. Such as “Foundation and Endowment Investing: Philosophies and Strategies of Top Investors and Institutions”, “Endowment Asset Management: Investment Strategies in Oxford and Cambridge”, “The Sustainable Endowment” or “The Household Endowment Model: Wealth Planning for Affluent Families.”
25. Known as Epstein-Zin utility.
26. It is an open question whether CAEY is a predictor of the expected arithmetic or geometric return of the equity market, but in either case, this criticism holds.
[James White](https://insights.elmwealth.com/elm-wealth-research/author/james-white)
[Read More](https://insights.elmwealth.com/elm-wealth-research/spending-like-youll-live-forever)
[In the News](https://insights.elmwealth.com/elm-wealth-research/tag/in-the-news)
### [Elm research wins Bernstein Fabozzi/Jacobs Levy Award](https://insights.elmwealth.com/elm-wealth-research/fabozzi-levy-award)
Mar 19, 2021, 12:00:00 AM
March 19, 2021
In the News
## Elm research wins Bernstein Fabozzi/Jacobs Levy Award
Last year, the Journal of Portfolio Management published our paper on factor investing, ‘Smart Beta: The Good, the Bad and the Muddy.’
It’s since become one of our most popular pieces, and we’re happy to announce that the paper has been awarded the Bernstein Fabozzi/Jacobs Levy Award for Outstanding Article.
For anyone who may have missed it, you can view the full paper [here](https://jpm.pm-research.com/content/early/2020/01/09/jpm.2020.1.126).
[James White](https://insights.elmwealth.com/elm-wealth-research/author/james-white)
[Read More](https://insights.elmwealth.com/elm-wealth-research/fabozzi-levy-award)
[Risk and Return](https://insights.elmwealth.com/elm-wealth-research/tag/risk-and-return)
### [Who is the Biggest Investor in the Stock Market, and Why Should You Care?](https://insights.elmwealth.com/elm-wealth-research/whos-the-biggest-investor)
Nov 23, 2020, 12:00:00 AM
November 23, 2020
Risk and Return
## Who is the Biggest Investor in the Stock Market, and Why Should You Care?
*By Victor Haghani and James White* [1](https://insights.elmwealth.com/elm-wealth-research/page/4#easy-footnote-bottom-1-3688)
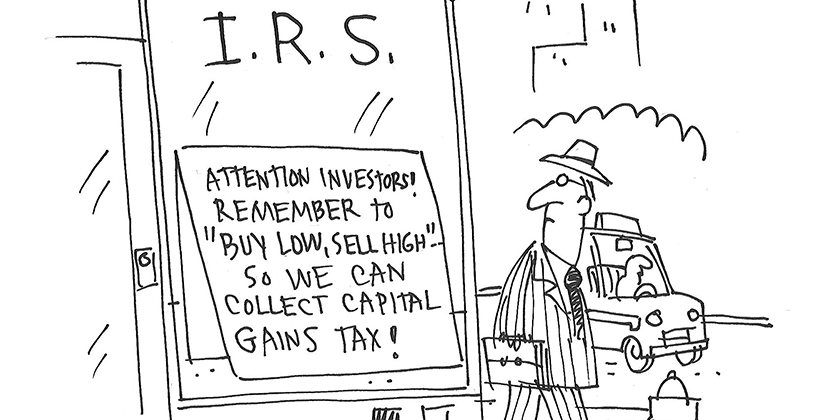
The US Treasury effectively “owns” about 24% of the stocks held by high income US taxable investors. Through the capital gains tax, Uncle Sam has an effective exposure of more than $1 trillion of equities.[2](https://insights.elmwealth.com/elm-wealth-research/page/4#easy-footnote-bottom-2-3688) And this huge-but-silent investor might be about to get a lot bigger if capital gains taxation is increased. But it’s not all bad news; luckily there is something you can do to lessen the blow. In this note, we’ll explain how adjusting your asset allocation to account for capital gains taxation can improve your after-tax expected welfare.
Last month, we wrote about a framework for deciding how much to accelerate the realization of capital gains if tax rates are likely to increase. The idea is to maximize your Expected Risk-Adjusted Wealth, which can often lead to a different decision than one based solely on the ‘static’ analysis of the single most likely scenario.[3](https://insights.elmwealth.com/elm-wealth-research/page/4#easy-footnote-bottom-3-3688) Linked to the decision of how much to accelerate is the question of how capital gains taxation impacts how much risk to take, which is the question we address in this note. Throughout this note, we’ll more generally use equities as a proxy for risky assets.
The primary take-aways for long-term investors are:
- increases in the capital gains tax rate often (but not always) lead to higher optimal equity allocations,
- in general, investors should respond to changes that increase the bite of capital gains tax, such as higher inflation or larger embedded unrealized gains, by increasing their exposure to equities,
- for a given dollar amount of expected tax, capital gains taxation is the kindest form it can take, as it reduces Expected Risk-Adjusted Wealth less than alternatives such as income or wealth taxes.
The optimal risk decision for a taxable investor is a function of too many variables to be reducible into a rule-of-thumb, which is why we have provided a calculator you can use along with the note.
[You can find our Decision Calculator here.](https://elmwealth.com/tax-calculator/)
[You can find the math and code behind the framework here.](https://colab.research.google.com/github/ElmPartners/Public/blob/master/Cap_Gains_Decisions.ipynb)
### The Impact of Capital Gains Tax on the Optimal Allocation to Equities
Let’s start with looking at whether a higher future capital gains rate should change how much to allocate to equities, which we expect to generate capital gains in the future but may also generate capital losses. Happily, there’s a long history of economists studying the effect of capital taxation on risk-taking. Economists have noted that if the government applied capital gains taxation symmetrically to gains and losses, then investors shouldn’t care about the tax rate at all; they would simply respond to increases in tax rates by increasing their exposure to the risky asset so as to keep the post-tax expected return constant.[4](https://insights.elmwealth.com/elm-wealth-research/page/4#easy-footnote-bottom-4-3688)
Unfortunately, we don’t live in a world of symmetric taxation, and it’s unlikely we’ll wake up in that world any time soon. Instead, we’re taxed on realized gains, with realized losses creating a tax-loss carry-forward credit which can only be used against future realized gains.[5](https://insights.elmwealth.com/elm-wealth-research/page/4#easy-footnote-bottom-5-3688) But understanding how things would work in the symmetric case is a good starting point for investors with very long horizons and/or who hold assets that are very appreciated versus their cost basis.
To fully answer the question of how the capital gains tax rate should impact an investor’s risk-taking, we’ll again reach for our Risk-Adjusted Wealth Maximization tool, which we used to crack the problem posed in our [To Realize or Not To Realize](https://elmwealth.com/to-realize-or-not-to-realize/) note. We’ll assume market expected returns and risk as set out in Table 1, such that in a zero-tax world our hypothetical investor (with a standard level of risk aversion) would maximize their Expected Risk-Adjusted Wealth by choosing a 70% equity/ 30% bond allocation.[6](https://insights.elmwealth.com/elm-wealth-research/page/4#easy-footnote-bottom-6-3688) Then, for any given set of tax rates, investment horizon and initial unrealized gains, we can find the optimal allocation to equities that results in the highest expected Risk-Adjusted Wealth. In Chart 1, we compare the optimal allocation to equities as a function of horizon, under four taxation assumptions:
- no taxation at all (dotted blue)
- taxation of interest at 50%, dividends at 30% and capital gains at 0% – for investors expecting to avoid paying capital gains tax completely (orange)[7](https://insights.elmwealth.com/elm-wealth-research/page/4#easy-footnote-bottom-7-3688)
- taxation of interest at 50% and dividends and capital gains at 30%, with no value on loss carry-forwards (green)
- taxation of interest at 50% and dividends and capital gains at 30%, with 50% value on loss carry-forwards (red)
If only interest and dividends are taxed, the optimal allocation to equities would be just a bit higher than in the no-taxation case. This is because, with our Base Case assumptions, taxing dividends reduces equity returns by slightly less than taxing interest reduces the return on the risk-free asset, making equities look slightly more attractive after-tax. When we introduce taxation of capital gains (the red and green lines) for investment horizons greater than 10 years, we see the predicted result of a higher optimal allocation to equities – although the effect is not as large as it would be in the pure symmetric case.
At horizons under 10 years, the presence of capital gains tax causes our investor to want a smaller equity allocation than in a tax-free world, if they place no value on loss carry-forwards. To see why, we can think of capital gains tax as being a call option sold for free by the investor to the government. For short horizons, the value of the call option takes a big chunk out of the expected return offered by equities, so owning less is optimal.[8](https://insights.elmwealth.com/elm-wealth-research/page/4#easy-footnote-bottom-8-3688) As the horizon lengthens, the optionality of the capital gains tax liability decreases as a per annum cost and the benefit of deferring the payment of the tax increases, resulting in an increasing optimal equity allocation. Figuring out exactly what is optimal for a given investor will depend significantly on how they value the potential tax-loss carryforward that may arise from a realized loss.[9](https://insights.elmwealth.com/elm-wealth-research/page/4#easy-footnote-bottom-9-3688)
### Sizing Up the Impacts of Taxation
In the idealized world from econ 101, with only a risk-free and a risky asset to choose from, no taxation, no transactions costs and asset prices that follow random walks, an investor’s optimal allocation to the risky asset is a function of just three variables: the risky asset’s excess expected return, its risk, and the risk-preferences of the individual. When we bring taxes into the problem, the optimal asset allocation becomes a function of many variables we can ignore in the zero-tax world. In Table 2 below, we use our tax calculator to see how the optimal allocation to equities changes based on changes in a range of variables, and also how these changes affect investor welfare. We use the assumptions in Table 1 as the Base Case, with a 20-year horizon.
For an investor starting out with large unrealized gains in their portfolio (row 6), we find that a larger equity allocation of 81% is optimal.[10](https://insights.elmwealth.com/elm-wealth-research/page/4#easy-footnote-bottom-10-3688) The increase in the optimal allocation to equities that results from higher unrealized gains suggests that as the market goes up, assuming expected returns remain the same, investors should want to increase their exposure to the market. The framework also suggests, as shown in row 5, that an increase in the capital gains tax rate should lead taxable, long-term investors to want to increase their allocation to equities, a conclusion that may run counter to the analysis of many market observers who view an increase in the capital gains rate as making equities less attractive. Of course, both of these effects are predicated on investors thinking about the impact of capital gains taxes in a framework similar to the one we are proposing, and the impact on markets will be driven by the characteristics of marginal investors who may look quite different from our long-term, taxable, utility-maximizing exemplar.
In the rightmost column of the table, we can see that an increase in the capital gains tax rate from 30% to 50% (row 5) is roughly equivalent to the harm caused by each of the following:
- An increase in unrealized gains in the portfolio of $35 per $100
- An increase in inflation of 1.25%[11](https://insights.elmwealth.com/elm-wealth-research/page/4#easy-footnote-bottom-11-3688)
- A decrease in the risk-free real rate of 0.25%
- A wealth tax of 0.2% per annum
Perhaps most surprising of these observations is the last one, that a 0.2% wealth tax decreases a long-term investor’s welfare as much as an increase in the capital gains tax from 30% to 50%, even though a 20% increase in capital gains tax would result in about three times as much expected taxes paid over the 20-year horizon as the wealth tax.[12](https://insights.elmwealth.com/elm-wealth-research/page/4#easy-footnote-bottom-12-3688) There are two reasons for this surprising equivalence: 1) the capital gains tax is paid at the end of 20 years while the wealth tax payments are spread out over the whole period, and 2) more significantly, the capital gains tax is paid only when the investments have done well, whereas the wealth tax is owed regardless. The same reasoning explains why just a 0.25% decrease in the risk-free real rate does the same harm to our investor’s welfare as a 20% hike in the capital gains tax rate. It is sobering to realize that the 4% drop in long-term US TIPS yields over the past 20 years has done far more damage to the welfare of current investors than any possible change to the long-term capital gains tax rate could inflict.
### Conclusion
The taxation of investment income and capital gains not only reduces the welfare of individual investors relative to a world of zero taxes on our savings (ignoring possible societal benefits of the taxes collected), but it also can materially affect our asset allocation decisions. Capital gains tax, due to its character as a one-sided tax, requires a framework that takes account of risk in outcomes and an investor’s personal risk-aversion. It is also notable that the level of real interest rates and inflation have a material impact on both our risk-adjusted wealth and our tax-adjusted optimal asset allocation.
From Table 2, we see that almost every change that hurts investor welfare is also associated with an increase in the optimal allocation to equities. In general, the greater allocation to equities softens the blow from the taxman taking a bigger slice of the investor’s pie.
We encourage you to spend some time with [our calculator](https://elmwealth.com/tax-calculator/), and please do get in touch with us if you’d like to discuss how this framework might be applied to your individual circumstances and decisions.
---
### Disclaimer:
In this note, we’ve provided a framework for thinking about tax-related investment decisions. Nothing in this note should be construed as tax advice pertaining to any individual’s specific circumstances, and your authors are not tax experts. We have simplified the problems we have discussed considerably, ignoring many important tax rules, including but not limited to: discussions of the impact of different rates for long-term versus short-term capital gains tax, different rates at different income levels, the value of capital gains tax loss carryforwards, estate, trust and charitable considerations, and many, many more.
---
### Further Reading and References:
- Domar, Evsey D. and Richard A. Musgrave. [“Proportional Income Taxation and Risk-Taking.”](https://academic.oup.com/qje/article-abstract/58/3/388/1896885?redirectedFrom=fulltext) The Quarterly Journal of Economics. Vol. 58, issue 3, 388-422. 1944.
- Feldstein, Martin. Capital Taxation. Harvard University Press. 1983.
- Feldstein, Martin. [“The Effects of Taxation on Risk Taking.”](https://www.journals.uchicago.edu/doi/10.1086/259560) Journal of Political Economy. Vol. 77, No. 5, 755-764. 1969.
- Haghani, Victor, Larry Hilibrand and James White. [“When it Pays to Pay Capital Gains.”](https://elmwealth.com/when-it-pays-to-pay/) 2019.
- Haghani, Victor and James White. [“How Much Should the Tax Tail Wag the Asset Allocation Dog?”](https://elmwealth.com/how-much-should-the-tax-tail-wag-the-asset-allocation-dog-a-rule-of-thumb-for-weighing-capital-gains-taxes-in-portfolio-rebalancing-decisions/) 2017.
- Haghani, Victor and James White. [“Measuring the Fabric of Felicity.”](https://elmwealth.com/measuring-the-fabric-of-felicity/) 2018.
- Haghani, Victor and James White. [“To Realize, or Not to Realize: Capital Gains Tax and Portfolio Choice.”](https://elmwealth.com/to-realize-or-not-to-realize/) 2020.
- Stiglitz, J. E. [“The Effects of Income, Wealth, and Capital Gains Taxation on Risk-Taking.”](https://doi.org/10.2307/1883083) The Quarterly Journal of Economics. Volume 83, Issue 2, 263–283. 1969.
---
1. This not is not an offer or solicitation to invest. *We are not tax experts and nothing in this note should be construed as tax advice.* **Past returns are not indicative of future performance.**
We are very grateful for the help of Larry Bernstein, Richard Dewey, Larry Hilibrand, Peter Hirsch, Mark Perwien, Jeffrey Rosenbluth and Roberta Sydney. All errors are our own.
2. Based on studies by the Federal Reserve on the distribution of stock market ownership by household net worth, and also supported by average US Treasury capital gains tax receipts of roughly $100 billion per year. See [here](https://home.treasury.gov/policy-issues/tax-policy/office-of-tax-analysis) and [here.](https://en.wikipedia.org/wiki/Wealth_inequality_in_the_United_States) This does not include further exposure of the US Treasury to US equities through corporate tax receipts, which tend to run twice the size of annual capital gains tax receipts.
3. For those familiar with Utility theory, Risk-Adjusted Wealth is equivalent to Certainty-Equivalent Wealth.
4. For example, see Domar and Musgrave (1944), Stiglitz (1969) and Feldstein (1969). Also assuming zero risk-free interest rates, that the capital asset has a zero dividend rate (which can be achieved for equity risk by using equity index futures), and that the investor is willing and able to borrow to leverage her position in the capital asset, if required, at the risk-free rate.
5. There are proposals to start taxing unrealized gains too. We’ll leave discussion of that for a future note, if it becomes more likely. Also, under current rules, taxpayers can allocate $3,000 of capital losses per year to offset earned income.
6. This could result, for example, from a view that equities have a 4.5% expected excess return and 18% risk, both per annum, and the investor’s preferences are represented by a CRRA utility function with coefficient of risk-aversion equal to 2. See our note [Measuring the Fabric of Felicity](https://elmwealth.com/measuring-the-fabric-of-felicity/) for the risk-aversion survey supporting this Base Case choice.
7. For example, by donating the assets to a charity or having children inherit the assets and utilize the step-up basis allowance.
8. It should be noted this is an odd sort of option contract, whereby the seller determines the expiration date of the option and under current rules the option goes away at death.
9. A parameter that we have built into the accompanying calculator.
10. The 81% is measured on the basis of $100 of portfolio value, ignoring the capital gains tax liability. If instead we value the starting portfolio at $89.50, net of the current value of the tax liability, then the desired allocation to equities is 90.5%, much closer to the 98.5% allocation that we’d get if capital gains taxation were applied symmetrically.
For a case of the risky asset having a zero basis, we find an optimal equity allocation of 85%, which scales up to 115% as a percentage of starting wealth minus current value of the tax liability, a result higher than the 98.5% optimal under symmetric taxation.
11. We assume that stock and bond prices do not fall when inflation rises. The impact of higher inflation on Risk-Adjusted Wealth in this scenario flows through the fact that investors are taxed on nominal income, not income after inflation.
12. In the Base Case, equities are expected to grow at 4% a year (6% total return less 2% dividend yield) so after 20 years $76 invested in equities would be expected to grow to $169 for a capital gain of $93 and at 20% tax, an extra $18.60 of tax, compared to about $5.70 of wealth tax payable over the period.
[James White](https://insights.elmwealth.com/elm-wealth-research/author/james-white)
[Read More](https://insights.elmwealth.com/elm-wealth-research/whos-the-biggest-investor)

[Tax Matters](https://insights.elmwealth.com/elm-wealth-research/tag/tax-matters)
### [To Realize, or Not to Realize](https://insights.elmwealth.com/elm-wealth-research/to-realize-or-not-to-realize)
Oct 22, 2020, 12:00:00 AM
October 22, 2020
Tax Matters
## To Realize, or Not to Realize
*By Victor Haghani and James White* [1](https://insights.elmwealth.com/elm-wealth-research/page/4#easy-footnote-bottom-1-3628)
This is a note about taxes, however: *we are not tax experts and
nothing in this note should be construed as tax advice.*
With the US presidential election just a few weeks away, it’s a good time to think about capital gains taxes. A number of our clients have been concerned about the possibility of significantly higher tax rates in the future and have asked us how we think about the investing implications of such a change. In this note, we suggest a framework based on maximizing expected risk-adjusted wealth for answering some of the important questions arising from the interaction of taxes and investing.[2](https://insights.elmwealth.com/elm-wealth-research/page/4#easy-footnote-bottom-2-3628) We believe this framework is superior to a conventional static analysis, and we’ll explain why as we dive into the central question arising from tax rates potentially increasing in the near future: to realize gains now, or to defer realization to the future.
Investment theory holds that in a world of efficient markets, random walks and no taxes, horizon shouldn’t materially affect many types of investment decisions. However what we have found is that as soon as tax enters the picture, horizon in many situations becomes the single most important input an investor needs to think about. We find that for investors with long horizons and moderate-size unrealized capital gains, it will usually make sense to defer realization even if the investor expects the tax rate to jump by 20 percentage points. We were surprised to find that at intermediate time horizons, the optimal decision can be to realize some, but not all, of the unrealized gains. Investment horizon isn’t the only critical input, and the interaction of all the relevant variables puts the development of a generic rule-of-thumb out of reach. Optimal decision-making in light of taxes is a function of many idiosyncratic and personal inputs, which is why we decided to provide a calculator you can use along with the note.
[You can find our Decision Calculator here.](https://elmwealth.com/tax-calculator/)
[You can find the math and code behind the framework here.](https://colab.research.google.com/github/ElmPartners/Public/blob/master/Cap_Gains_Decisions.ipynb)
*The central question we will address in this note is whether it is better to sell (and re-purchase) appreciated assets now and pay today’s long-term capital gains tax rate, or wait to realize gains in the future and pay a likely higher capital gains tax rate.*
At first, this may seem like a fairly straightforward problem of weighing a bigger payment in the future against a smaller payment today: simply a question of the time value of money using an appropriate discount rate.[3](https://insights.elmwealth.com/elm-wealth-research/page/4#easy-footnote-bottom-3-3628) In many circumstances, the decision would ride on a choice between different plausible discount rates. For example, in the base case we’ll discuss below, we’d want to realize early if we chose the risk-free interest rate, while we’d defer realization to the horizon if we used the expected return of a plausible risky asset. But as we’ll explain in this note, there is no robust way to choose an appropriate discount rate in a static framework. There are three main problems with the conventional approach, which all arise from the fact that risk is an integral part of the problem:
1. The conventional analysis captures only one of many possible scenarios. For example, the asset may drop below its cost basis resulting in no tax liability in the future, as the government doesn’t pay us “negative taxes” when we have a capital loss.[4](https://insights.elmwealth.com/elm-wealth-research/page/4#easy-footnote-bottom-4-3628) A sound analysis needs to take account of all possible outcomes. Chart 1 shows how realizing gains now vs. later can result in dramatically different changes in value depending on the final level of the risky asset at the investment horizon.[5](https://insights.elmwealth.com/elm-wealth-research/page/4#easy-footnote-bottom-5-3628)
2. Considering many possible scenarios and making decisions which maximize your expected wealth still may not lead us to the correct decision. The problem is that maximizing expected wealth leads to absurd decisions around risk-taking: for any investment with a positive expected return above the risk-free rate, investing more in that investment will always lead to higher expected wealth, so it can’t help to answer any questions involving trade-offs between risk and return.[6](https://insights.elmwealth.com/elm-wealth-research/page/4#easy-footnote-bottom-6-3628)
3. The conventional static comparison, by construction, cannot find that a partial realization of gain is optimal, even though (as we’ll see below) there are cases when that’s exactly what an investor should do.
In addition, although of lesser impact, the static analysis doesn’t take into account the effect a higher future tax rate may have on how much of the risky appreciated asset you want to hold going forward, nor can it determine how tax rate uncertainty impacts the optimal allocation decision.
The goal in sound financial decision-making is to make choices which offer the best risk-adjusted result. This requires accounting both for uncertainty in outcomes and for the decision-maker’s personal level of risk-aversion. The standard approach to quantifying an individual’s aversion to risk is through their utility function: a mapping between wealth and the benefits of wealth, its utility. Classical utility functions show utility increasing with wealth – but as wealth increases, it produces diminishing marginal gains in utility, as illustrated in Chart 2. This has a deep connection to risk-aversion and risk-taking: given a risky situation, the more your loss of utility is disproportionately large relative to a potential gain, the more compensation you require to bear that risk. Thus, the more concave the utility curve, the more risk-averse the individual.
To make good risk-adjusted decisions, we need to find choices which maximize an individual’s expected utility, not expected wealth.[7](https://insights.elmwealth.com/elm-wealth-research/page/4#easy-footnote-bottom-7-3628) There’s a direct correspondence between utility and risk-adjusted wealth (they’re interchangeable) – so going forward, we’ll perform our calculations using utility, and then express our results in terms of risk-adjusted wealth. That will allow us to compare different decisions in dollars rather than units of utility, which some readers may find too abstract. Armed with this tool, and assuming a typical degree of investor risk-aversion, we can determine to what extent we should realize a capital gain at the lower tax rate today.[8](https://insights.elmwealth.com/elm-wealth-research/page/4#easy-footnote-bottom-8-3628)
To do this, we calculate expected risk-adjusted wealth for each possible amount of immediate realization and each possible allocation to the risky asset, as follows:
1. For each possible price of the risky asset at the investment horizon, we calculate how much *after-tax* wealth the investor would have.[9](https://insights.elmwealth.com/elm-wealth-research/page/4#easy-footnote-bottom-9-3628)
2. We use the investor’s utility function to translate that amount of after-tax wealth into personal utility.
3. We multiply each amount of utility by the probability of the risky asset realizing the corresponding price at the horizon, using the risky asset’s assumed expected return and risk. We add up the probability-weighted utility values, and this gives us expected utility.
4. Using the investor’s utility function, we translate from expected utility into risk-adjusted wealth.
The result is an Expected Risk-Adjusted Wealth curve as a function of how much gain to realize immediately, given an optimal allocation to the risky asset.
To illustrate this analysis, we’ll assume the investor has a 20-year horizon, that the risky asset (a stock ETF, for example) has an expected return of 6% with 18% volatility, and that the long-term capital gains tax rate will go from 30% today to 50% in the future. We’ll also assume that the investor must pay tax at the horizon, without the benefit of tax mitigations such as step-up basis for estate and charitable purposes, 1031 exchanges or moving state tax jurisdictions (although all of these could be modeled within this framework).[10](https://insights.elmwealth.com/elm-wealth-research/page/4#easy-footnote-bottom-10-3628) If the investor has a capital loss at the horizon, we assume a zero value for the loss carryforward. The full set of assumptions are in Table 1.
Chart 3 displays the risk-adjusted wealth curves for different initial levels of current unrealized gain, assuming an optimal risk allocation and a starting portfolio worth $100 (ignoring the tax liability). These curves allow us to find the decision – the percentage of gain to realize today – that maximizes expected risk-adjusted wealth. For an asset with 0 initial unrealized gain (blue), whether we sell the asset now or later doesn’t matter as there is no gain to realize; as expected, we see expected risk-adjusted wealth is constant. For our base-case unrealized gain of 35% (orange), realizing nothing now produces the highest gain in expected risk-adjusted wealth of approximately $20.5, the leftmost point on the curve. If the investor instead chose to realize all gains today, the rightmost point on the orange curve, their expected risk-adjusted wealth would fall to roughly $18.5.
Things get more interesting in the case of a starting unrealized gain of 70% of the portfolio value (green) – an admittedly extreme case of the asset having a zero basis. In this case, we get the intriguing result that it is optimal to realize about half the gain immediately, which delivers about $4 more risk-adjusted wealth than no immediate realization, and $2 more than full immediate realization. In the base case, a discount rate of 3.7% would produce the same conclusion to defer realizing the gain and an increase in value of $2[11](https://insights.elmwealth.com/elm-wealth-research/page/4#easy-footnote-bottom-11-3628) – but notice that in the case of a higher unrealized gain of 70%, there exists no discount rate to use in a static analysis which would suggest optimally realizing half the gain, or optimally realizing any fractional amount.
Notice also that the green curve of this 70% gain case gets very flat around the optimal decision to immediately realize 50% of the gain. If the investor decided to realize 40% or 60% of the gain, their expected risk-adjusted wealth would be almost the same. This is a general feature of decisions that come out of this framework: getting close to optimal delivers almost all the expected benefits of the precise optimal decision. But, the further away one moves from optimality, the expected welfare of the investor declines ever more swiftly.
To get a better feel for what’s going on, let’s look at how the optimal amount to realize changes with time horizon, as illustrated in Chart 4.
We can see that if you have a short horizon, it’s optimal to realize a high fraction of current gains – but as horizons lengthen out, you want to realize less and less. Why might this be? For a very short horizon, say just one minute, it makes sense to realize 100% of the gain right away, re-establish the position and then liquidate it after the 1 minute has elapsed.[12](https://insights.elmwealth.com/elm-wealth-research/page/4#easy-footnote-bottom-12-3628) Over that very, very short horizon, it’s fair to expect very little price change in the risky asset, so taking the gain now is pretty much a no-risk, no-brainer. However, as the horizon gets longer, risk enters the calculus as the relative benefit of the realization decision is tied to the risky asset price at the horizon, as illustrated in Chart 1. The risk of early realization has the general profile of being short an option: if the asset price doesn’t move much, the investor is better off taking advantage of the lower tax rate by realizing early, but if the asset price goes down or up dramatically, deferring realization will have been the better decision. A big drop in the asset price will leave the investor with a non-refundable tax loss,[13](https://insights.elmwealth.com/elm-wealth-research/page/4#easy-footnote-bottom-13-3628) while a big rise in the asset price favors deferral as it allows the investor who hasn’t paid tax early to have a larger exposure to the risky asset. At the same time, the time value component of deferring paying taxes goes up with an increasing horizon. These two effects shift the balance towards deferring realization as horizon lengthens.
So far we have treated the future capital gains tax rate as known with certainty, but it’s easy enough to see how tax rate risk impacts the realization decision. In Chart 5, using the assumptions in our base case, we plot the optimal realization decision comparing the case where the capital gains rate increases to 50% versus the case where there’s an equal chance that it’s unchanged at 30%, goes up to 50%, or goes up to 70%. Notice that all we’ve done is introduce tax rate risk, as we’ve left the expectation of a 50% future tax rate the same in both cases. What we find is that tax rate uncertainty pushes the investor to realize more gains at every horizon up to a horizon a bit beyond 20 years, when full deferral is suggested under both sets of future tax rate assumptions. The reason we get this result is that our investor is risk-averse, and uncertainty in the future capital gains tax rate introduces risk into deferral.[14](https://insights.elmwealth.com/elm-wealth-research/page/4#easy-footnote-bottom-14-3628)
### Conclusion
Making sound financial decisions under uncertainty requires finding the decision that maximizes your expected *risk-adjusted* wealth. Doing so often involves more than a back-of-the-envelope calculation, but the math is not terribly complex – and we’ve provided a calculator to do the heavy lifting for you. While the cases we’ve dealt with in this note have been simplified, the framework we’ve proposed is flexible enough to handle more realistic setups, including a more general, multi-period lifetime saving, spending and investment framework, and also an integration of correlations between tax rates, asset prices, inflation and interest rates. If you’re interested in building your own calculator to handle more complex or personalized cases, we’ve shared our Jupyter Notebook with the core framework, equations, and Python code.
The core points we’d like to leave you with are:
1. The expected-utility framework is superior to a static analysis for answering tax questions involving uncertain outcomes and produces sensible results which maximize risk-adjusted wealth. This approach can suggest partial realization as optimal, a solution that is not possible within the conventional solution.
2. Horizon is very important: At shorter horizons, it tends to make sense to realize some amount of gains early when capital gains tax rates are expected to rise, while deferring gains is more attractive at longer investment horizons.
3. Under many circumstances, the difference in risk-adjusted wealth between the optimal decision and a bad decision is great enough to warrant an investor spending some time to make a thoughtful decision. However, in the neighborhood of the optimal decision, risk-adjusted wealth differences are small, so it’s reasonable to get in the ballpark of the best decision without worrying about a high degree of precision.
In practice, most investors see themselves as having multiple horizons over which they expect to liquidate assets to fund spending, and portfolios generally have a mix of assets with different cost bases and different characteristics. This adds complexity to the analysis, but doesn’t change its basic character – making decisions that maximize expected risk-adjusted wealth is the best way to improve your expected welfare.
We encourage you to spend some time with our calculator, and please do get in touch with us if you’d like to discuss using this framework or how it might be applied to your individual circumstances and decisions.
---
### Disclaimer:
In this note, we’ve provided a framework for thinking about tax-related investment decisions. Nothing in this note should be construed as tax advice pertaining to any individual’s specific circumstances, and your authors are not tax experts. We have simplified the problems we have discussed considerably, ignoring many important tax rules, including (but not limited to) discussions of the impact of different rates for long-term versus short-term capital gains tax, different rates at different income levels, the value of capital gains tax loss carryforwards, estate, trust and charitable considerations, and many, many more.
---
### Technical Appendix
The capital gains tax rate *τ0* will be changing tomorrow to *τ* . You have some amount of homogenous unrealized gains *g0* , and you want to know whether you should realize your gains now (or more generally, what fraction should be realized), given that you also want to hold the optimal of the risky asset to horizion *T* , at which point you’ll realize any additional gains and pay any taxes.
We assume the risky asset *S* follows a GBM with mean return *μ* and volatility *σ* , and that you have CRRA utility with elasticity *γ* . *S* also pays a dividend at rate *δ* which is taxed at *τd* .
As usual, we want to optimize expected utility:
U(θ,κ) = 𝔼 \[u P̂T\]
where:
u(w) { w1 – γ – 1 1 – γ , γ ≠ 1
u(w) = ln(w), γ = 1
P̂T = PT – (φ+ + α(1 – T Tc )+ φ–) τ
φ = (1 – θ – ε)g + PTe–κ T δ(1 – τd) – P0
ε = 1 κ0 ((κ0 – κ)+ – κ0 θ)+
PT = P0e(κ(μ – δTd) + (1 – κ)(1 – τ1)r – ½ κ2 σ2)T + κ σ ZT
P0 = 1 – (θ + ε)gτ 0
Note: *ε* is the amount of extra immediate gain realization (if any) additional to *θ* called for by rebalancing the risk asset from *κ0* to *κ* . *α* is the multiple applied to the asset value of a loss carryforward if received today, and *Tc* is the time after which loss carryforwards have no asset value.
---
### Further Reading and References:
- Domar, Evsey D. and Richard A. Musgrave. [“Proportional Income Taxation and Risk-Taking.”](https://academic.oup.com/qje/article-abstract/58/3/388/1896885?redirectedFrom=fulltext) The Quarterly Journal of Economics. Vol. 58, issue 3, 388-422. 1944.
- Feldstein, Martin. Capital Taxation. Harvard University Press. 1983.
- Feldstein, Martin. [“The Effects of Taxation on Risk Taking.”](https://www.journals.uchicago.edu/doi/10.1086/259560) Journal of Political Economy. Vol. 77, No. 5, 755-764. 1969.
- Haghani, Victor and James White. [“How Much Should the Tax Tail Wag the Asset Allocation Dog?”](https://elmwealth.com/how-much-should-the-tax-tail-wag-the-asset-allocation-dog-a-rule-of-thumb-for-weighing-capital-gains-taxes-in-portfolio-rebalancing-decisions/) 2017.
- Haghani, Victor, Larry Hilibrand and James White. [“When it Pays to Pay Capital Gains.”](https://elmwealth.com/when-it-pays-to-pay/) 2019.
- Stiglitz, J. E. [“The Effects of Income, Wealth, and Capital Gains Taxation on Risk-Taking.”](https://doi.org/10.2307/1883083) The Quarterly Journal of Economics. Volume 83, Issue 2, 263–283. 1969.
---
1. This not is not an offer or solicitation to invest, nor should this be construed in any way as tax advice. **Past returns are not indicative of future performance.**
We are very grateful for the help of Larry Bernstein, Larry Hilibrand, Peter Hirsch, Mark Perwien, Marlin Risinger, Jeffrey Rosenbluth and Roberta Sydney. All errors are our own.
2. For those familiar with Utility theory, Risk-Adjusted Wealth is equivalent to Certainty-Equivalent Wealth.
3. Assuming the price of the asset at the horizon is at or above its current price.
4. The taxpayer does get a capital loss carryforward, which can be used against future capital gains. In our analysis in this note, we’ll be assuming that capital loss carryforwards have no value beyond the investor’s chosen horizon. However, the proposed framework can handle multiple horizons and assigning value to capital loss carryforwards, a feature we have built into the calculator.
5. The chart assumes the investor makes the same percentage allocation to the risky asset regardless of realizing the gain early.
6. Assuming the ability to borrow at the risk-free rate to invest arbitrarily more.
7. This decision framework is a superset of the well-known Kelly Criterion, not an opposing framework as it’s sometimes portrayed. Optimizing expected utility given log-utility and binary bets reproduces the Kelly Criterion exactly.
8. We’ll assume the investor exhibits Constant Relative Risk-Aversion (CRRA) utility with coefficient of 2, which means the investor would have an optimal allocation to equities of about 70% based on an expected excess return of 4.5% and equity volatility of 18%, ignoring tax effects. See our survey on CRRA risk aversion [here.](https://elmwealth.com/measuring-the-fabric-of-felicity/)
9. In calculating the value of the portfolio at the horizon, we make the unrealistic (but non-impactful) assumption that the investor maintains the chosen percentage asset allocation over the entire period without incurring taxes in the process of rebalancing the portfolio to keep the allocation constant.
10. Nor in this note will we consider other tax mitigation approaches such as hedging of appreciated assets, splitting assets between taxable accounts and non-taxable accounts such as IRAs or tax-loss harvesting strategies run on portfolios of many individual equity holdings.
11. Explanation of 3.7% discount rate: realizing a $35 gain today at a 30% tax rate creates a tax payable of $10.50, while realizing $35 at a 50% tax rate in 20 years produces a tax payable of $17.50. Discounting $17.50 at 3.7% per annum for 20 years gives a present value of $8.50 which is $2 less than the $10.50 generated by realizing today.
12. We assume there are no transaction costs, and there are no wash sale restrictions on realizing gains and re-establishing positions, as far as we know, although as stated already, this is not tax advice.
13. For an investor with multiple horizons, a tax-loss at an early horizon will have some value as a carryforward to a longer horizon. This is straightforward to incorporate into the framework described herein, and it is built in to the calculator that accompanies this note.
14. Tax rate uncertainty can also support the decision to convert a traditional IRA into a Roth IRA even for an investor who doesn’t expect higher tax rates in the future, as the conversion and resultant tax payment upfront reduces the risk associated with uncertain future tax rates. A number of other variables also significantly drive the conversion decision.
[James White](https://insights.elmwealth.com/elm-wealth-research/author/james-white)
[Read More](https://insights.elmwealth.com/elm-wealth-research/to-realize-or-not-to-realize)

[Featured Insights](https://insights.elmwealth.com/elm-wealth-research/tag/featured-insights)
### [Steadfast, Greedy, or Fearful?](https://insights.elmwealth.com/elm-wealth-research/steadfast-greedy-or-fearful)
Jun 3, 2020, 12:00:00 AM
June 3, 2020
Featured Insights
## Steadfast, Greedy, or Fearful?
*By Victor Haghani and James White* [1](https://insights.elmwealth.com/elm-wealth-research/page/4#easy-footnote-bottom-1-3391)
March 2020 packed 2 ½ years of normal U.S. stock market volatility into one month, making it the most volatile month on record. Daily variability clocked in at 6%, six times higher than the average over the past 90 years. How should an investor respond to such volatility? There are at least three schools of thought:
1. *Steadfast:* Stay the course and don’t be shaken by short-term swings in volatility. When setting your asset allocation to begin with, assume that the stock market will be much more volatile than normal from time to time, and when that happens take it in stride. As Vanguard founder John Bogle said, *“Don’t pay a lot of attention to the volatility in the marketplace. All these noises and jumping up and down along the way are really just emotions that confuse you.”* [2](https://insights.elmwealth.com/elm-wealth-research/page/4#easy-footnote-bottom-2-3391)
2. *Greedy:* Increase your exposure to the market, because, as Warren Buffett has counseled, *“Be fearful when others are greedy and greedy when others are fearful.”*
3. *Fearful:* Reduce your exposure to the market because it has become riskier right now. This approach, known as “Volatility Targeting,” has been researched and supported by a host of respected academicians, with Ray Dalio, founder of the Bridgewater hedge fund group, its highest profile practitioner.[3](https://insights.elmwealth.com/elm-wealth-research/page/4#easy-footnote-bottom-3-3391)
Let’s work through these arguments in a world of two investments: a risk-free asset and the stock market. Let’s say you’re an investor who has just retired and has wealth well in excess of what’s needed to provide the basics for your family.[4](https://insights.elmwealth.com/elm-wealth-research/page/4#easy-footnote-bottom-4-3391) How much you would optimally allocate to the stock market depends on your estimate of its return and risk relative to the risk-free asset, your personal degree of risk aversion, and how much savings you need to set aside to meet basic needs.[5](https://insights.elmwealth.com/elm-wealth-research/page/4#easy-footnote-bottom-5-3391) As we’ll discuss below, which of the three schools of thought will appeal to you most will depend primarily on where you look for your estimates of expected risk and return.
### Steadfast
Many investors and researchers use long-term market history to extrapolate future expected returns. This is the foundation of the Bogle recommendation: assume long-term return and risk are constant and ignore changes in short-term volatility and valuation metrics. We’re generally skeptical of backward-looking, historically-based forecasts of the future, though Bogle’s counsel is easy to follow and has the potential psychological advantage of helping an investor look through times of stress and turmoil. Most proponents of the steadfast approach recommend periodic portfolio rebalancing to maintain static target asset allocation weights.[6](https://insights.elmwealth.com/elm-wealth-research/page/4#easy-footnote-bottom-6-3391)
### Greedy
A more adaptive, and forward-looking approach acknowledges that the long-term expected return of the market varies over time. Among the most commonly used, and effective, estimators of the future return of the stock market is the Cyclically-Adjusted Earnings Yield popularized by Robert Shiller. Importantly, it’s a predictor of the very long-term market real return, ignoring the hard-to-predict changes in sentiment that dominate shorter-term returns. If we rely on this long-term estimator, then it follows we should want to use a similarly long-term measure of risk, which will be relatively unaffected by swings in short-term volatility.[7](https://insights.elmwealth.com/elm-wealth-research/page/4#easy-footnote-bottom-7-3391) This is consistent with Buffett’s advice to be greedy when others are fearful: when the stock market goes haywire and drops precipitously, long-term expected returns have likely gone up, while long-term risk is little changed.
### Fearful
*“The long run is a misleading guide to current affairs. In the long run, we are all dead. Economists set themselves too easy, too useless a task if in the tempestuous seasons they can only tell us that when the storm is long past the ocean will be flat.”*
– J.M. Keynes, *A Tract on Monetary Reform* (1923)
While the “Earnings Yield” estimate of the market’s long-term return is based on expected cash flows in the form of earnings and dividends, in the short run, stocks are driven primarily by changes in how market participants discount those future cash flows. As Benjamin Graham put it: *“In the short run, the market is a voting machine but in the long run it is a weighing machine.”* A Volatility Targeting strategy scales exposure inversely to short-term market volatility, increasing exposure when volatility is low and decreasing it when volatility is high. There are several lines of thought which support Volatility Targeting.[8](https://insights.elmwealth.com/elm-wealth-research/page/4#easy-footnote-bottom-8-3391) Many practitioners focus on the desirability of keeping portfolio volatility constant over time, which may give investors greater peace of mind and potentially the confidence to take higher levels of risk over time. Indeed, Volatility Targeting is the optimal strategy under the assumption that the Sharpe Ratio (i.e. return-to-risk ratio) of equities stays constant as short-term volatility varies.[9](https://insights.elmwealth.com/elm-wealth-research/page/4#easy-footnote-bottom-9-3391) Another popular theory suggests the market systematically under-reacts to changes in short-term volatility.[10](https://insights.elmwealth.com/elm-wealth-research/page/4#easy-footnote-bottom-10-3391) The idea is that when an asset’s short-term volatility goes up, investors are slow to mark down its price enough to make the expected short-term return high enough to warrant holding as much of that asset. By reducing exposure when volatility goes up, the volatility-targeter seeks to get ahead of the slow but necessary mark-down process.
In practice, there are many impactful details to implementing a Volatility Targeting strategy, which is why historical studies reach varying conclusions on its effectiveness. We found that studies which assume the least practical implementations for ordinary investors produced the most attractive historical results. The chart below is based on how we imagine an individual investor with a baseline asset allocation of 75% US equities and 25% T-bills might actually apply Volatility Targeting, with no leverage and rebalancing each month-end. Please see the Appendix for full details of all historical backtests. The Volatility Targeting strategy did well from 1985 to the present, but less so over the entire period. We explored a wide range of different implementations and none that we could find was significantly better than what’s displayed below.
### A Different Shade of Fearful: Momentum
*“…most of the time the trend prevails…. Most of the time we are punished if we go against the trend.”*
– George Soros, *Soros on Soros: Staying Ahead of the Curve*
There is another indicator of short-term returns that has a loyal group of followers, and has some strong similarities with Volatility Targeting: Momentum. Time Series Momentum is measured by comparing today’s market level to a reference point, usually 6 – 12 months in the past for asset allocation purposes. If Momentum is positive, meaning today’s level is higher than its recent average, it indicates that near-term returns will be higher than if Momentum is negative. Researchers have found that Momentum is predictive of near-term asset price performance across virtually all assets that have been investigated.[11](https://insights.elmwealth.com/elm-wealth-research/page/4#easy-footnote-bottom-11-3391) There are many theories for why Momentum has worked; nearly all are based on behavioral foibles, grounded in the tendency of investors to extrapolate recent performance. The result is “return-chasing” behavior, creating trends in asset prices that Momentum indicators identify as they start to unfold. The chart below shows that a Momentum-driven portfolio performed quite a bit better than a static portfolio historically. In all 9 decades from 1930 to 2020, the 10-year return on the Momentum portfolio was higher than the static portfolio, with roughly the same risk (please see Appendix for more detail).
### Volatility Targeting versus Momentum
Researchers have long noticed that volatility tends to rise when the stock market falls, and vice versa, which suggests that for equities Volatility Targeting and Momentum signals tend to line up most of the time.[12](https://insights.elmwealth.com/elm-wealth-research/page/4#easy-footnote-bottom-12-3391) We found that from 1928 – 2020 they in fact did point in the same direction 67% of the time. The chart below shows that over this period Momentum pretty consistently out-performed the Volatility Targeted dynamic portfolio. In 8 of the 9 decades from 1930 to 2020, the 10-year return on the Momentum portfolio was higher than the return on the Volatility Targeted dynamic portfolio, with the same risk over the past 50 years, and slightly higher risk over the full period. The Momentum portfolio also had a modestly higher Sharpe ratio.
We emphasize that such backtests do not by themselves provide enough evidence to warrant applying either approach, or preferring one to the other: past returns do not indicate future performance. We always need to ask whether the historical patterns we have found are the result of randomness, structural features, or systematic investor behavior. Even if we believe it’s not the result of chance, we need to also believe it’s likely these behaviors will persist in the future and outweigh the actions of other investors who are trying to take advantage of them.
Looking past the historical data, if you believe investors are focused on short-term return and risk, and are slow to adjust prices to changes in volatility, then you may be more attracted to Volatility Targeting, even though Momentum has historically done better as an indicator of short-run returns. However, if you are more attracted to the paradigm that return-chasers drive market dynamics, then you’ll find Momentum an attractive indicator to use in scaling your exposure to the market. Of course they are not mutually exclusive, and you may want a blend of both strategies. One good question to ask is whether you believe that high volatility in a rising stock market would have the same predictive power as high volatility in a falling market. Is it high volatility or the market’s recent direction that is primarily driving near-term returns? [13](https://insights.elmwealth.com/elm-wealth-research/page/4#easy-footnote-bottom-13-3391)
Finally, even if you view Volatility Targeting and Momentum as equally likely to improve the risk-adjusted return of your portfolio, you may also want to consider the relative complexity of implementation, which favors Momentum as the strategy with fewer choices to make.
### Conclusion
What does all this mean for how you should respond to extreme market volatility? Depending on how you think about long-term and short-term returns, and your desire for simplicity in managing your savings, we see merits in all the schools of thought, individually or in any combination. At Elm, we favor a fusion of Buffett’s approach for determining our long-term allocation to equities with Soros’ advocacy of Momentum to adjust for investors’ penchant to chase returns in the short term.
---
### Appendix: Details of Historical Performance of Volatility Targeting, Momentum and Static Portfolios
**Data**
We used daily S&P 500 index price data from finance.yahoo.com using the series ^GSPC. We used dividend and US CPI data from Professor Robert Shiller’s [website](http://www.econ.yale.edu/~shiller/data.htm) to create a real total return index for the US stock market from December 31, 1928 to March 27, 2020. For T-bills, we also used Robert Shiller’s online data, using the one-year T-bill rate as a proxy for a daily T-bill rate. For the real return of the static portfolio, we assumed the portfolio was held at a constant asset allocation of 75% equities and 25% T-bills, rebalanced back to those weights at the end of each month. We assumed no transactions costs or frictions of any kind in these historical analyses. The data table below has an estimate of turnover for each of the portfolios.
**Volatility Targeting**
For the Volatility Targeting portfolio, we used the historical average 60-day rolling US equity volatility over the whole 1928 – 2020 period of 16.5% as the target level of volatility at which the portfolio will be 75% allocated to equities.[14](https://insights.elmwealth.com/elm-wealth-research/page/4#easy-footnote-bottom-14-3391) For our base case, we set the allocation to equities, *W\* = 75% \* 16.5% / Vol* , where *Vol* is equal to annualized volatility of equity returns over the past 60 trading days. One way of thinking about this form of Volatility Targeting is that it assumes that in the short term the Sharpe Ratio of the equity market stays constant by the expected return of equities changing in proportion to changes in short-term volatility. As an illustration of the application of this rule, at the time of writing 60 day realized volatility was 63% pa, calling for an allocation to equities of 20%. We imposed a no-leverage constraint by capping the desired allocation to equities at 100%. The average allocation to equities over the whole period was 82.2%, higher than the 75% static baseline. The quality of historical returns measured by Sharpe Ratio is not materially changed by different choices target level of volatility. We also ran historical simulations using 20-day and 40-day lookback windows, squeezed volatility estimates in the spirit of GARCH analysis, and also we used VIX implied market volatility from 1990 onwards, the period over which VIX data was available. None of these choices for estimating market volatility as an input to the asset allocation rule made the historical returns of Volatility Targeting materially different. It is not surprising that using implied volatility didn’t materially improve the results of Volatility Targeting. Since 1990, one-month implied volatility has explained about 50% of next month’s realized volatility, about the same predictive power we get from predicting next month’s realized volatility using the past month’s realized volatility. We also explored using the Merton Rule at the end of each month to set the target allocation to equities, *W\* = μ / γ / σ2* , which is consistent with the assumption that the short-term expected return of equities remains constant despite changes in short-term market volatility. This is referred to as “Variance Targeting.” We held the expected excess return, *μ* , constant at 5%, the coefficient of risk aversion, *γ* constant at 2.5,[15](https://insights.elmwealth.com/elm-wealth-research/page/4#easy-footnote-bottom-15-3391) and volatility, *σ* , equal to the past 60 business days’ realized stock market volatility. We chose these parameters for their reasonableness and as they result in an average asset allocation not too far from the static baseline target of 75% equities. This approach also did not materially improve the quality of returns versus our baseline Volatility Targeting parameterization. We explored daily rebalancing, which roughly quadrupled turnover, without a material increase in quality of returns. We relaxed the leverage constraint to allow the investor to hold up to a 4x leveraged exposure to equities (an implementation we strongly advise against), but again this did not materially change the Sharpe Ratio of the strategy, although it did materially increase absolute historical returns. The only assumption which substantially improved the performance of Volatility Targeting was the unrealistic presumption that the investor had perfect foresight with regard to future realized volatility.[16](https://insights.elmwealth.com/elm-wealth-research/page/4#easy-footnote-bottom-16-3391)
**Momentum**
Momentum was measured as the current total real return index less the average of the total return index over the past year less 2.5%. The purpose of subtracting 2.5% is to make the incidence of positive and negative Momentum roughly equal. The target allocation for the Momentum portfolio was set at the end of each month as 100% equities/0% T-bills if Momentum was positive, and 50% equities/50% T-bills if Momentum was negative. We also used a Momentum signal based on a six month look-back window, and the results were similar to those from the one-year lookback. The average allocation to equities over the whole period was 79.2%, higher than the 75% static baseline, and lower than the average 82.2% equity exposure in the Volatility Targeting strategy.
The table below provides further details of the historical simulations explored.
---
### Further Reading and References:
- Black, Fischer. *“Studies of Stock Price Volatility Changes.”* Proceedings of the 1976 Meeting of the Business and Economic Statistics Section, *American Statistical Association*, 177-181. 1976.
- Engle, R. *“Autoregressive Conditional Heteroskedasticity with Estimates of the Variance of U.K. Inflation.”* Econometrica 50: 987–1008, (1982).
- Fleming, J., C. Kirby and B. Ostdiek. *“The Economic Value of Volatility Timing.”* The Journal of Finance 56 (1): 329–352. 2001.
- Fleming, Jeff, Chris Kirby and Barbara Ostdiek, [*“The economic value of volatility timing using realized volatility.”*](http://www.ruf.rice.edu/~jfleming/wp/ii.pdf) Journal of Financial Economics 67, 473–509. 2003.
- French, Kenneth R., G. William Schwert and Robert F. Stambaugh. [*“Expected Stock Returns and Volatility.”*](https://repository.upenn.edu/cgi/viewcontent.cgi?article=1056&context=fnce_papers) Journal of Financial Economics 19, 3–29. 1987.
- Geczy, Christopher and Mikhail Samonov. [*“Two Centuries of Price Return Momentum.”*](https://papers.ssrn.com/sol3/papers.cfm?abstract_id=2292544) Financial Analysts Journal, Vol. 72, No. 5. Sep 2016.
- Harvey, Campbell R., Edward Hoyle, Russell Korgaonkar, Sandy Rattray, Matthew Sargaison and Otto Van Hemert. [*“The Impact of Volatility Targeting.”*](https://faculty.fuqua.duke.edu/~charvey/Research/Published_Papers/P135_The_impact_of.pdf) Journal of Portfolio Management. Fall 2018.
- Lochstoer, Lars and Tyler Muir. [*“Volatility Expectations and Returns.”*](https://sites.insead.edu/facultyresearch/research/file.cfm?fid=65651&p%) INSEAD. 2019.
- Merton, Robert. *“Lifetime Portfolio Selection under Uncertainty: The Continuous-Time Case.”* The Review of Economics and Statistics, Vol. 51, No. 3. Aug. 1969.
- Moskowitz, Tobias, Yao Hua Ooi and Lasse Heje Pedersen. [*“Time Series Momentum.”*](http://docs.lhpedersen.com/TimeSeriesMomentum.pdf) Journal of Financial Economics. 2012.
- Tang, Yi, and Robert F. Whitelaw. *“Time-varying Sharpe ratios and market timing.”* Quarterly Journal of Finance 1, 465–493. 2011.
---
1. This not is not an offer or solicitation to invest, nor should this be construed in any way as tax advice. **Past returns are not indicative of future performance.**
We thank Antti Ilmanen, Campbell Harvey and Myron Scholes for their helpful comments. Of course, the views, analysis and any errors are solely our own.
2. [MarketWatch: Why Bogle and Buffett tell investors to ignore market noise](https://www.marketwatch.com/story/why-bogle-and-buffett-tell-investors-to-ignore-market-noise-2015-06-04)
3. In a 2010 white paper titled “Engineering Targeted Returns and Risks,” Dalio explained “how to structure a portfolio to target a 10% return with 10-12% risk.” While Bridgewater’s Volatility Targeting implementation is proprietary, it is believed that they use longer-term measures of volatility, which would dampen their reaction to changes in volatility over the short run.
4. Or, if you’re still working, you have a secure job that makes your human capital very low risk and stable, like a government bond.
5. Robert Merton provided an early solution to this problem:
*W\* = (μ – r) / (γσ2)*
where *W\** is the fraction of wealth in excess of subsistence needs to allocate to the risky asset, *μ* is the expected return of the risky asset, *r* is the risk-free rate, *σ* is the expected variability of the risky asset and *γ* is the investor’s level of risk aversion. See our note [Measuring the Fabric of Felicity](https://elmwealth.com/measuring-the-fabric-of-felicity/) for a deeper discussion, particularly of *γ* .
6. Some would argue that maintaining static weights is an active strategy, in that it calls for buying equities when they fall and selling when they rise. One’s choice of benchmark against which to measure other investment approaches is important and can have a significant influence on the selection of the optimal strategy. For example, see our recent note: [Back to the Future: Reviving a 19th Century Perspective on Financial Well-Being](https://elmwealth.com/back-to-the-future/), in which we argue that an investor’s choice of minimum risk asset will have a profound influence on portfolio choice.
7. Let’s take an investor with a 25-year planning horizon. He believes stock market volatility will be 18% a year in the long run, and it’s been running at 18% in the short run. But then all of a sudden, there’s a panic and one-month volatility (i.e. VIX) goes to 50%. But he expects volatility to drop half-way back to 18% in a couple of months. Under these assumptions, the short-term spike in volatility would only raise 25-year expected volatility from 18% to 18.5%.
8. See French et al. (1987), Fleming et al. (2003), Tang and Whitelaw (2011), Harvey et al. (2018), Lochstoer and Muir (2019).
9. Optimal under the Merton Rule. For a slightly different perspective, invoking the concept of time-diversification, see this [interview](https://www.youtube.com/watch?v=D5mDcrwxmgY) with Myron Scholes.
10. Lochstoer and Muir (2019) state: *“Slow moving expectations about volatility lead agents to initially underreact to volatility news followed by a delayed overreaction.”*
11. See Moskowitz et al. (2012) and Geczy and Samonov (2016).
12. First noted in Black (1976). Harvey et al., pp14, 31 (2018):
*“Risk assets exhibit a so-called leverage effect (i.e., a negative relation between returns and volatility), and so volatility scaling effectively introduces some Momentum into strategies. That is, volatility often increases in periods of negative returns, causing positions to be reduced, which is in the same direction as what one would expect from a time-series Momentum strategy. Historically such a Momentum strategy has performed well…we show that it is indeed the Momentumness of volatility scaling that explains a large part of the cross-sectional variation in the Sharpe ratio improvement when using volatility scaling for the various assets considered.”*
13. An example of one such period to consider is the five year period starting in late February 1932, during which the S&P 500 experienced a real total return of 23.5% per annum, with realized volatility of 35%.
14. Realized volatility over the whole 1928 – 2020 period, measured using daily data was 19.3%, higher than the overlapping 60 day realized volatility was 16.5%. This difference is mostly due to the distribution of daily returns being significantly fat-tailed versus a standard normal distribution.
15. See our note [Measuring the Fabric of Felicity](https://elmwealth.com/measuring-the-fabric-of-felicity/) for a discussion of the coefficient of risk aversion.
16. Perfect foresight is highly beneficial in nearly all realms of investing, and we commend its use whenever possible.
[James White](https://insights.elmwealth.com/elm-wealth-research/author/james-white)
[Read More](https://insights.elmwealth.com/elm-wealth-research/steadfast-greedy-or-fearful)

[Featured Insights](https://insights.elmwealth.com/elm-wealth-research/tag/featured-insights)
### [Back to the Future: Reviving a 19th Century Perspective on Financial Well-Being](https://insights.elmwealth.com/elm-wealth-research/back-to-the-future)
May 13, 2020, 12:00:00 AM
May 13, 2020
Featured Insights
## Back to the Future: Reviving a 19th Century Perspective on Financial Well-Being
*By Victor Haghani and James White* [1](https://insights.elmwealth.com/elm-wealth-research/page/4#easy-footnote-bottom-1-3350)
*“Mr. Darcy soon drew the attention of the room by his fine, tall person, handsome features, noble mien, and the report which was in general circulation within five minutes after his entrance, of his **having ten thousand a year.**“*
– Jane Austen, *Pride and Prejudice* (1813)
These days, we tend to assess our net worth by tallying up the market value of our financial assets, even though it might be more natural to think of our wealth as a stream of dollars over time given the nature of our income and spending. Perhaps this fixation on lump sum wealth is induced by the media – you won’t find Elon Musk on any rich list appraised at $1 billion per year, even though that’s about what his $40 billion of stock holdings would be worth in annuity form. But if you see your savings as a means to the end of future spending and bequests, the per-year measure seems more appropriate.
Let’s entertain the idea that what we really care about is the long-term, inflation-adjusted purchasing power which $1 can lock in today – we’ll call this the ‘Real Annuity Value’ of $1.[2](https://insights.elmwealth.com/elm-wealth-research/page/4#easy-footnote-bottom-2-3350) This shift in perspective has some pretty big implications for how we save and invest. For one, we have to rethink the notion that T-bills and other cash proxies, such as money market funds and bank deposits, are the lowest-risk assets we can own. While it’s true that the nominal value of T-bills doesn’t go up or down much day to day, we’ll see them as dramatically more risky once we focus on their Real Annuity Value.
The chart below shows the ‘real’ (i.e. inflation-adjusted) total return history of T-Bills, in terms of both dollars and Real Annuity Value:
As you can see, in dollars T-Bills had very low risk as well as very low real total return. Not so when looking at their performance expressed in Real Annuity Value: if you were invested in T-Bills over the whole period, by the end you could only buy half the Real Annuity you could have bought at the beginning. That’s a really significant loss of long-term purchasing power for a supposedly low-risk investment. The much lower Real Annuity Value delivered by T-bills is not a result of inflation, which we’re accounting for. Instead, it’s because long-term real interest rates, which set the payout of real annuities, dropped from 3.75% in 1997 to about 0% today. Looking further back in time, investments in US T-bills lost about 33% and 40% respectively of their Real Annuity Value over 1916 – 1920 and 1940 – 1948.[3](https://insights.elmwealth.com/elm-wealth-research/page/4#easy-footnote-bottom-3-3350)
Now let’s do the same comparison for the S&P 500:
We see that, while the total returns differ, equities are about as equally volatile measured in dollars or in Real Annuity Value. T-Bills lost about 50% of their Real Annuity Value, while equities gained about 50% – respectable, though far less than their dollar gains of over 200%.
It’s easy to read too much into these charts over any given period, but one interpretation is that equities are intrinsically a bit like a real annuity themselves: they provide an indefinite stream of earnings, which naturally adjust somewhat to inflation. They’re risky and have a volatile risk premium relative to the Real Annuity Value, but nonetheless they’re more like a real annuity than T-Bills are.[4](https://insights.elmwealth.com/elm-wealth-research/page/4#easy-footnote-bottom-4-3350)
### Conclusion:
*“Our approach to saving is all wrong: We need to think about monthly income, not net worth.”*
– Robert C. Merton, HBR (2014)
We’ve seen that T-Bills and similar cash-like assets are significantly more risky in terms of Real Annuity Value than they appear when viewed in plain dollars. Given their generally low expected real return, this makes cash-like assets look pretty unappealing to hold in excess of amounts needed to cover near-term expenses and contingencies. In contrast, equities are not significantly more risky in this new light, and may be even more attractive if we believe the long-term expected earnings streams they generate makes them a form of a long-term, real annuity. In our recent note [Taking Stock,](https://elmwealth.com/taking-stock/) we found that the stock market currently looks more attractive viewed from the Real Annuity Value perspective, both prospectively and relative to historical valuations.
Back in Jane Austen’s day, wealth was harder to value and less liquid than it is today – one reason why it was more common to think about it as an annual flow, rather than an upfront value. While it’s more straightforward to measure your investment portfolio as a current lump sum value, a significant fraction of most peoples’ financial resources – their human capital and future social security and pension benefits – are much more readily thought of as long-term real annuities. If you see your wealth as a reservoir for long-term future consumption, we think it’s well worth the extra mental effort to think about all your financial resources and decisions with the Real Annuity Value perspective.
---
### Appendix: Real Annuity Value Mechanics
Once we start measuring financial well-being in terms of long-term annual purchasing power, we’ll need to identify a new risk-free asset to take the place of T-bills.[5](https://insights.elmwealth.com/elm-wealth-research/page/4#easy-footnote-bottom-5-3350) What we need is an asset that pays a real $1 per year for many years, and with the highest assurance of payment possible. US Government Treasury Inflation-Protected bonds (TIPS) are a pretty good candidate, even though their cash flows aren’t quite in the form of a long-term real annuity due to their principal repayment at maturity.
Improving upon TIPS as our risk-free asset to generate the historical return charts in this note, we constructed a new currency: the RA-$ (for Real Annuity Dollar) which represents $0.02 per year for the next 50 years, adjusted for inflation. The value of the RA-$ will fluctuate versus the regular Dollar, driven by long-term real interest rates, which we can get from the market pricing of TIPS. Since long-term real interest rates are about zero right now, the value of RA-$1 currently would be equal to about $1, as 2 cents per year, inflation-adjusted for 50 years equals $1 discounted at a zero real interest rate. In early 1997, at the start of the period in our chart, long-term real interest rates were about 3.75%, making the value of RA-$1 about $0.50 regular Dollars.
Prior to 1997 – when the US Treasury started issuing TIPS – the notion of Real Annuity Value and RA-$’s would have been purely hypothetical. Over the past twenty years, there have been many books and articles from experts in personal finance such as Robert Merton, Zvi Bodie and John Campbell that argue the Real Annuity Value framework is the most consistent and logical one for reaching sound personal financial decisions, and that investors should adopt TIPS as their minimum risk asset in lieu of T-bills and other cash-like investments. If investors were to embrace this shift in perspective more broadly, the long-term TIPS market would have to grow well beyond its current size of $215 billion, which is less than 1% of the total US Treasury and investment grade bond market.
---
### Further Reading and References:
- Austen, Jane. *Pride and Prejudice.* 1813. Reprint: Penguin Books, 2003.
- Bodie, Zvi and Rachelle Taqqu. *Risk Less and Prosper: Your Guide to Safer Investing.* Wiley. 2011.
- Breeden, Doug. [*“An Intertemporal Asset Pricing Model with Stochastic Consumption and Investment Opportunities.”*](https://static.secure.website/wscfus/8149792/uploads/Breeden_1979_JFE_Consumption_CAPM_Theory.pdf) Journal of Financial Economics, pp. 265-96. 1979.
- Campbell, John and Luis Viceira. [*“Who Should Buy Long-Term Bonds?”*](https://pubs.aeaweb.org/doi/pdfplus/10.1257/aer.91.1.99) American Economic Review 91.1, pp. 99-127. March 2001.
- Heldman, James. [*“How Wealthy is Mr. Darcy – Really?”*](http://www.jasna.org/persuasions/printed/number12/heldman.htm) Jane Austen Society of North America. 1990.
- Merton, Robert, C. [*“The Crisis in Retirement Planning.”*](https://robertcmerton.com/wp-content/uploads/2017/08/The-Crisis-in-Retirement-Planning-HBR-2014-Merton.pdf) Harvard Business Review. July–August 2014.
- Merton, Robert C. and Arun Muralidhar. [*“Time for Retirement ‘SeLFIES’?”*](https://papers.ssrn.com/sol3/papers.cfm?abstract_id=2945668&download=yes) SSRN. 2017.
- White, James and Victor Haghani. [*“The Equity Risk Premium: A Novel Perspective on the Past Fifty Years.”*](https://papers.ssrn.com/sol3/papers.cfm?abstract_id=3558041) SSRN. March 2020.
---
1. This not is not an offer or solicitation to invest, nor should this be construed in any way as tax advice. **Past returns are not indicative of future performance.**
Thank you to Bob Merton for his suggestions and for sharing his thoughts on this topic, to which his decades of research and writing have contributed so much. Thanks also to Vlad Ragulin (one of Bob’s many students) and Rich Dewey for their valuable comments.
2. An annuity is a fixed sum of money paid each year, typically for a long period of time. A real annuity pays a fixed inflation-adjusted sum of money each year. US Social Security payments can be thought of as a real annuity, with a start date at entitlement age.
3. As per data made available by Professor Robert Shiller [here.](http://www.econ.yale.edu/~shiller/data.htm) We assume that the level of real rates did not change over these two periods. Nominal rates changed little, and unfortunately long-term real rate data does not exist for those time periods.
4. A laddered portfolio of US Treasury Inflation-Protected Securities (TIPS) are the most like a real annuity that an investor could buy, and is a good candidate for the minimum risk asset an investor can buy.
5. In this note, we focus on a risk-free Real Annuity as a benchmark and numeraire for assessing one’s financial resources and making investment decisions. However, an even more accurate metric would take account of the expected return and risk of the full investment opportunity set as well as one’s personal aversion to risk. Such a measure would use the long-term risk-adjusted return of an investor’s desired portfolio instead of the long-term risk-free real rate to compute the Real Annuity Value to be used as one’s personal numeraire.
[James White](https://insights.elmwealth.com/elm-wealth-research/author/james-white)
[Read More](https://insights.elmwealth.com/elm-wealth-research/back-to-the-future)

[Risk and Return](https://insights.elmwealth.com/elm-wealth-research/tag/risk-and-return)
### [George Costanza At It Again: The Leveraged ETF Episode](https://insights.elmwealth.com/elm-wealth-research/george-costanza-at-it-again)
Apr 16, 2020, 12:00:00 AM
April 16, 2020
Risk and Return
## George Costanza At It Again: The Leveraged ETF Episode
*By Victor Haghani and James White* [1](https://insights.elmwealth.com/elm-wealth-research/page/4#easy-footnote-bottom-1-3319)
### Sometime in late 2018…
George: *How about this stock market? Down 14% in three months. It’s killing me. Day after day and all I see are big red numbers next to every single one of my investments. Everything I buy goes straight down – I can’t take it!*
Kramer: *Ooooooweee, buying stocks is no good.*
George: *No good?*
Kramer: *Here’s a can’t-lose strategy for you: invest half your money in SPXL and the other half in SPXS.*
George: *I never heard of these stocks before – what are they?*
Kramer: *They’re not stocks, they’re ETFs – Exchange Traded Funds, and they’re TURRRRBO-charged! SPXL is a 3x leveraged long S&P 500 ETF and SPXS is a 3x leveraged short S&P 500 ETF. There’s no limit to how much they can go up, and you can’t lose more than you put into them. One or the other is gonna make you rich. Kaching!*
George: *It’s gotta be better than what I’m doing now. What could possibly go wrong?*
### 15 Months Later…
George: *KRAMER!! What’d you do to me?!!? I should never have listened to you.*
Kramer: *What are you talking about? What’s the problem?*
George: *It’s those two leveraged ETFs you told me about. The stock market is up 6% since our little chat, but SPXL and SPXS are both down big – one is down 20% and the other one is down almost 50%!*
Kramer: *Hmmm…doesn’t seem possible. I’ve got another idea: have you ever thought about doing the opposite of whatever you think is a good idea?*
George: *I tried that already, and I’d rather not talk about it.[2](https://insights.elmwealth.com/elm-wealth-research/page/4#easy-footnote-bottom-2-3319)*
### Leveraged ETF Returns: Not What George Was Expecting
George’s surprise at losing on both SPXL and SPXS is understandable; they sound like direct opposites of each other. Given the 3x leverage and the stock market up 6%, he probably expected SPXL to be up about 18% and SPXS to be down about 18%. Instead both under-performed the ‘expected’ result by over 30%. The ETFs were not poorly managed, and the relatively high fees (about 1%) can’t come close to explaining the performance gap. In understanding what’s going on with these ETFs, we’ll uncover an important lesson relevant to all investing, about how your choice of investment size can be more important than your choice of investment.
These highly leveraged long and short ETFs provide a perfect illustration of how overly-aggressive investment sizing can turn a good trade into a losing one. An investor who borrows money to take a leveraged position in an asset will need to keep trading the asset in order to maintain a constant level of leverage as the asset price fluctuates. For example, 3x leveraged ETFs are structured and labeled as being constantly 3x leveraged through time, on a daily basis. For a 3x long ETF, that means the ETF needs to buy every day asset prices go up, and sell when they go down. This creates a nasty surprise: if the S&P 500 starts at 2500, goes up to 3000 one day, then back to 2500, the 3x-long ETF has to buy at 3000 and then sell at 2500, locking in a loss over the two days even though the market is flat. We’ll refer to this locked-in loss that comes from trading to maintain constant leverage as ‘volatility drag.’[3](https://insights.elmwealth.com/elm-wealth-research/page/4#easy-footnote-bottom-3-3319) Over any given day, the 3x leveraged ETF return is equal to 3x the daily return – but over multiple days, because of this daily trading, the 3x leveraged return will be lower by an amount that depends on how volatile the market has been.[4](https://insights.elmwealth.com/elm-wealth-research/page/4#easy-footnote-bottom-4-3319)
High leverage combined with high realized volatility has a powerfully negative impact on returns, enough to explain George’s realized return of -20% for SPXL and -50% for SPXS relative to the market return of +6%.[5](https://insights.elmwealth.com/elm-wealth-research/page/4#easy-footnote-bottom-5-3319) In the chart below, we show how George’s 3x-leveraged long ETF would have done over a range of returns for the S&P 500, given the 28% realized volatility of the stock market over his holding period.[6](https://insights.elmwealth.com/elm-wealth-research/page/4#easy-footnote-bottom-6-3319) For SPXL to have outperformed an unleveraged investment, the market needed to go up by more than 22% to overcome the leverage-induced volatility drag.
### Market Impact of Leveraged ETFs: 1987 Portfolio Insurance Redux?
Even though George hadn’t heard about these leveraged ETFs, they’ve been around since 2006 – and they’ve grown to be more than a side-show in the marketplace. According to Lara Crigger’s research at ETF.com, leveraged ETFs had assets of close to $40 billion at the end of March 2020,[7](https://insights.elmwealth.com/elm-wealth-research/page/4#easy-footnote-bottom-7-3319) and that’s just tallying up the US-listed structures that are publicly registered – there’s likely considerably more in privately-structured products and non-US vehicles.
To gauge the potential market impact of these leveraged long and short ETFs, let’s take a closer look at what trades SPXL and SPXS would have to execute after a 10% market rise:
We can see that after this 10% market rise, SPXL is now under-levered and SPXS is over-levered. To return to 3x-long and 3x-short, *both* ETFs need to buy more S&P 500. SPXL needs to buy $60 of the S&P 500 and SPXS needs to buy $120. If the market falls instead, the numbers are the same but the ETFs will need to sell. As you can imagine, the turnover within these levered funds can be enormous; for a 3x leveraged-long ETF assuming 1% daily moves (16% annualized), annual turnover would be 1500%, and 3000% for a 3x leveraged-short ETF.
In terms of the potential market impact of the trades these ETFs need to do each day, we estimate that the managers of these public leveraged ETFs need to buy or sell about *$10 billion* of equities when the stock market goes up or down by 5%, and most of that trading has to happen near the closing bell each day. Of course, many market participants are aware of these, and other similarly predictable flows coming from options-hedging and leveraged investment strategies such as Risk Parity and volatility targeting funds. In trying to profit from these anticipated flows, opportunists smooth them out and make them harder to pinpoint, but their impact doesn’t completely disappear.[8](https://insights.elmwealth.com/elm-wealth-research/page/4#easy-footnote-bottom-8-3319)
### Sizing Your Stock Market Exposure for the Long-Term
As you know from our other research notes, we think choosing your equity allocation should be a forward-looking exercise, driven by your assessment of future return and risk, and your own circumstances and personal level of risk aversion. That said, it’s still interesting and instructive to take a look back sometimes, and we’re going to take a look at how different levels of stock market exposure – including leveraged – would have performed over the long-term.
From 1927 to the end of March 2020[9](https://insights.elmwealth.com/elm-wealth-research/page/4#easy-footnote-bottom-9-3319), the annualized total return on the S&P 500 was 9.6%, which would have turned a $1mm investment into $4.5 billion today – not too shabby. Average stock market volatility was just under 19%, and T-Bills returned 3.7% p.a. If you were around in 1927 and had a crystal ball, wouldn’t you have been tempted to invest in equities on margin and really make a killing for your lucky descendants? After all, if investing 100% of your savings in equities for the long-term was sure to be great, why not invest 200% or 300% of your savings?
The table below works through this thought experiment, showing how things would have turned out for an equity investor taking on different amounts of leverage over those nearly 100 years.[10](https://insights.elmwealth.com/elm-wealth-research/page/4#easy-footnote-bottom-10-3319) Notice that 1.5x leverage leaves you with the most money at the end, but at some point you’d have experienced a drawdown of 95%. Above 1.5x leverage, return goes down and risk goes up, driven by the volatility drag we’ve been discussing. At 4x leverage, after suffering more than a 99.99% drawdown, you’d eventually only be left with the $1 you started with (just $0.09 inflation-adjusted), and at 5x leverage you’d have been fully wiped out on October 19th, 1987. Here’s an interesting thought-experiment: what equity exposure would you have chosen standing in 1927 with the crystal ball?[11](https://insights.elmwealth.com/elm-wealth-research/page/4#easy-footnote-bottom-11-3319)
### Opposite George?
What if George followed Kramer’s advice, and did the opposite of whatever he thought was a good idea so instead of buying these two leveraged ETFs, he shorted them? As we explained in [our first note](https://elmwealth.com/george-costanza-hedge-fund-manager/) about George’s investing, being short is not the opposite of being long. In fact, if we assume that an investor shorting either of George’s ETFs wants to keep the value of her short equal to her capital in the trade (including unrealized losses or gains along the way), then being short the 3x leveraged long ETF looks exactly the same as being long the 3x leveraged short ETF, and vice versa.
The closest thing to achieving the opposite of the leveraged ETFs’ volatility drag would be to invest in a balanced portfolio, such as 50% equities and 50% T-bills. Maintaining the 50% / 50% weight over time would require buying equities when they go down and selling when they go up, creating a volatility ‘lift’ instead of a ‘drag’ from the portfolio rebalancing. Unfortunately, this lift is naturally limited in scale – you can create as much drag as you want by using large leverage, but you can only get the maximum lift by maintaining a position size at 50% of total capital.
### Conclusion
A big problem with holding these leveraged long and short ETFs for more than one day is that most investors are likely to think they are making a decision based on a view of where the market is going: up or down. As we’ve explained though, that’s not typically what they’re getting.[12](https://insights.elmwealth.com/elm-wealth-research/page/4#easy-footnote-bottom-12-3319) Rather, the return on a leveraged long or short ETF held over time will incur a drag that increases dramatically with both leverage and realized volatility. As George’s experience attests, the investor can have the right call on market direction while the investment outcome is overwhelmed by the impact of high realized volatility.
The exchange between George and Kramer is fictional, but the disappointing returns on George’s two leveraged ETFs are sadly quite real. The lesson from George’s misadventure isn’t only for those thinking about investing in highly leveraged ETFs. For all investments, as position size increases, there’s a point beyond which you’ll be more likely to wind up with losses than with gains, and further still, an amount of exposure at which you’ll be almost assured of losing all your money. Much of the art of investment sizing lies in appreciating and optimizing where on the curve is right for you.
---
### Further Reading and References:
- [“Report of the Presidential Task Force on Market Mechanisms.”](https://ia802605.us.archive.org/0/items/reportofpresiden01unit/reportofpresiden01unit.pdf) The Brady Commission, January 1988.
- Cheng, Minder and [Ananth Madhavan](mailto:Ananth.Madhavan@blackrock.com). [“Dynamics of Leveraged and Inverse ETFs.”](https://www.q-group.org/wp-content/uploads/2014/01/Madhavan-LeverageETF.pdf) Q-Group, 2009.
- [ETF Research Collection.](https://sites.google.com/site/timleungresearch/etfs) Professor Tim Leung, Columbia University.
ETF Database:
- [Leveraged 3X ETF List](https://etfdb.com/themes/leveraged-3x-etfs/)
- [SPXL Ticker Profile](https://etfdb.com/etf/SPXL/#etf-ticker-profile)
ETF.com
- Crigger, Lara. [Leveraged ETF Closues Piling Up](https://www.etf.com/sections/features-and-news/bloodbath-leveraged-etfs)
- Crigger, Lara. [Why These Leveraged Energy ETPs Tanked](https://www.etf.com/sections/features-and-news/why-these-leveraged-energy-etps-tanked)
- Crigger, Lara. [Don’t Buy and Hold Leveraged ETFs](https://www.etf.com/sections/features-and-news/dont-buy-and-hold-leveraged-etfs)
- Crigger, Lara. [The Truth About Leveraged ETF Returns](https://www.etf.com/sections/blog/21176-the-truth-about-leveraged-etf-returns.html)
- [UWT ETF Profile Page (via FactSet)](https://www.etf.com/UWT)
- [DWT ETF Profile Page (via FactSet)](https://www.etf.com/DWT)
---
1. This not is not an offer or solicitation to invest, nor should this be construed in any way as tax advice. **Past returns are not indicative of future performance.**
Thank you for the very helpful comments from our friends Antti Ilmanen, Chi-fu Huang, David Modest, Jeffrey Rosenbluth, Josh Haghani, Lance McGray,Lara Crigger, Mark Haghani, Richard Dewey and Samir Bouaoudia, and a special thanks to Larry Bernstein for bringing these ETFs and their perplexing performance to our attention.
2. See our note [If George Costanza Were a Hedge Fund Manager](https://elmwealth.com/george-costanza-hedge-fund-manager/) for more of George’s mis-adventures in investing. Inspired by *Seinfeld* Season 5, Episode 22, [‘The Opposite.’](https://www.youtube.com/watch?v=cKUvKE3bQlY)
3. If the investor chooses not to rebalance the portfolio, the volatility drag is transformed from a relatively constant cost through time into a path-dependent, one-off risk of total wipeout, without changing the overall expected outcome.
For example, if the two ETFs George had invested in started at 3x leverage and then did no rebalancing, the result would have been that SPXL would have returned about +12%, but SPXL would have lost 100% in mid-February 2020, when the S&P 500 had gained over 33.3% since the start of George’s investment. So, with no rebalancing, George’s combined ETF investment would have lost 44%, rather than the loss of 35% on the daily rebalanced ETFs we’re discussing in this note. Of course, this was just one path, but it’s a good illustration of how the rebalancing frequency introduces path dependency.
4. Here’s a formula which explains the poor performance of George’s ETFs:
*Retf = L \* R̂index – (L \* σindex)2 / 2*
where *Retf* = ETF daily return which can then be compounded up to get a return for the period desired,
*L* = leverage ratio, positive if long and negative if short,
*R̂index* = the average daily return of the index, and
*σindex* = the standard deviation of the daily returns of the index.
For simplicity, we assume that the risk-free rate is zero. The formula assumes the index follows a geometric Brownian motion.
5. To explain George’s return on the 3x Leveraged Long and short ETF, we need the following information: average daily return on index= 0.0325%, daily stdev on index = 1.74%, daily avg T-bill rate = 0.0059%, 314 days in period. Plugging these into the formula in footnote 4 we get expected losses of 15.4% and 47.5%, compared to actual losses of 20% and 50%, on the 3x leveraged long and short ETFs respectively. The balance of the losses is mostly explained by the 1.06% pa fees on both ETFs and the cost of leverage incurred in the ETFs being worse than the T-bill rate we used.
6. We assume the ETF finances its leveraged position at 1% above the average T-bill rate, and that the ETF charges a fee of 1% p.a.
7. Split about 50/50 between 2x and 3x leveraged ETFs, 60/40 between long vs short, and about 75% in equities.
8. It’s hard to know the impact of flows of this size. Although it’s a datapoint from a long time ago (when the US stock market was about 10% of its current size) the Brady Commission’s report on the October 19, 1987 stock market crash estimated that about $6 billion of selling by Portfolio Insurance programs over the course of the whole day was primarily responsible for turning a bad day into the worst day ever, -22.5% for the US stock market.
9. We chose that period as it’s the longest for which we can easily find daily S&P 500 data.
10. The table assumes daily rebalancing, no transactions costs, no fees, no impact, borrowing at 3 month T-bill rates +1%.
11. Robert C. Merton, in his 1969 paper [Lifetime Portfolio Selection Under Uncertainty](https://www.jstor.org/stable/1926560?read-now=1&seq=1#page_scan_tab_contents), suggested a simple formula, subject to a stylized set of assumptions, for determining how much equity exposure one should optimally take based on the expected excess return of equities over the return of the risk-free asset, the risk of equities and the degree of personal risk aversion of the investor.
For an investor whose crystal ball gave a precise estimate of the expected return and risk of the equity market over the 1927-2020 period that matched the realized market experience, and who had a level of risk aversion in line with investors we surveyed in [our 2018 study](https://elmwealth.com/measuring-the-fabric-of-felicity/),(coefficient of risk aversion = 2.5) the optimal equity allocation would be about 85%.
12. The few leveraged ETF prospectuses we’ve reviewed explain this as well.
[James White](https://insights.elmwealth.com/elm-wealth-research/author/james-white)
[Read More](https://insights.elmwealth.com/elm-wealth-research/george-costanza-at-it-again)
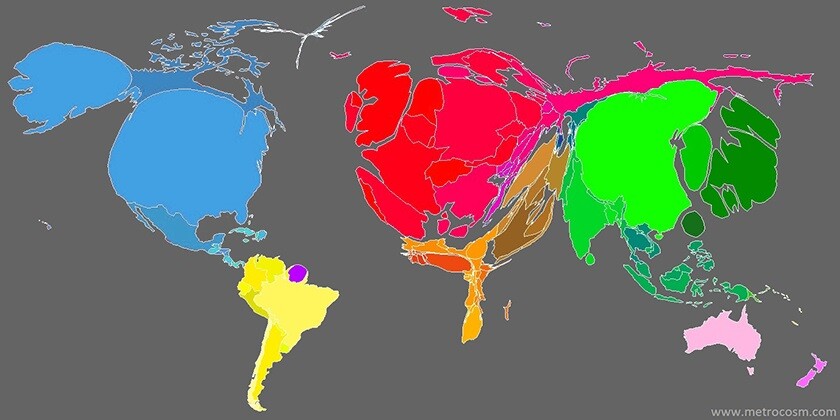
[How Elm Works](https://insights.elmwealth.com/elm-wealth-research/tag/how-elm-works)
### [Introducing the Elm Partners All-Equity Portfolio For Non-US Investors](https://insights.elmwealth.com/elm-wealth-research/epaep)
Apr 6, 2020, 12:00:00 AM
April 6, 2020
How Elm Works
## Introducing the Elm Partners All-Equity Portfolio For Non-US Investors
*By Victor Haghani and James White* [1](https://insights.elmwealth.com/elm-wealth-research/page/4#easy-footnote-bottom-1-3287)
Encouraged by some of our investors, we are introducing a new fund for non-US investors, the Elm Partners All Equity Portfolio (EPAEP). EPAEP will have a Baseline of 100% Global Equities, in contrast to our current Global Balanced Fund which has a Baseline of 65% Global Equities, 5% Commodities, and 30% Global Fixed Income.
The Fund will be managed algorithmically with a dynamic asset allocation driven by valuation and momentum, in line with the Active Index Investing® approach we’ve applied since 2012 to our Global Balanced portfolios. EPAEP will use low cost ETFs, will charge our standard 0.12% per annum management fee and will maintain our usual focus on cost and tax efficiency. The Fund will be long-only, un-levered, and will always have a target of being fully invested in global equities. This note describes details of the asset allocation methodology, implementation and historical return simulation. Please feel free to email [info@elmwealth.com](mailto:info@elmwealth.com) or set up a [call](https://elmwealth.com/contact-us/schedule-a-call/) with us if you’d like to learn more or request a Prospectus.
### Target Investor Group
The All-Equity Fund is designed for non-US investors who want Elm’s global diversification and value-and-momentum approach to equities, but who want a relatively constant amount of equity exposure or want to manage their cash and fixed-income assets on their own.
In contrast, Elm’s Global Balanced Fund is designed for investors who want Elm to dynamically manage their exposure to equities versus fixed-income, with a balanced 70%/30% Baseline Asset Allocation as the starting point. This may be suitable for investors who want Elm to manage a meaningful fraction of their liquid wealth, who want to be more hands-off with their asset allocation, and who want an investment program with a risk level that varies through time as a function of the attractiveness of available investments.
Investors can also invest in both the Global Balanced and All-Equity Funds to achieve a Baseline risk level in between that of the two funds. This may be suitable for investors who want the dynamic risk level of a Balanced program, but who have a tolerance for a higher level of variability and expected return. With the normal caveats about past returns not being predictive of the future, simulated historical returns for the All-Equity program over the past roughly 40 years had about 50% more variability and 20% higher real returns than did the Global Balanced strategy, as described more fully in the Historical Simulation section below.
### Background
Elm’s Active Index Investing® attempts to combine the best features of active investing and index investing to deliver superior long-term risk-adjusted returns. We do not follow the market-cap-weighting regimes of MSCI or FTSE, but rather we systematically construct our own Baseline Asset Allocations which we feel are more representative, diversified and risk/return efficient. We then add a dynamic overlay to our Baseline, following the principle that allocations should be proportional to forward-looking expected real returns, and drawing on value and momentum as the two primary indicators of expected returns. Allocating proportionally to expected real return has deep roots in Samuelson and Merton’s work on Decision-Making Under Uncertainty starting in the early 1960s,[2](https://insights.elmwealth.com/elm-wealth-research/page/4#easy-footnote-bottom-2-3287) and commonly used applications such as the Kelly Criterion. In turn, the value and momentum perspective was popularized by Asness, Moskowitz and Pedersen in their seminal “Value and Momentum Everywhere” paper, and by our own research including “A Case Study for Using Value and Momentum at the Asset Class Level,” in the Journal of Portfolio Management, which traced this market phenomenon back to 1925.[3](https://insights.elmwealth.com/elm-wealth-research/page/4#easy-footnote-bottom-3-3287)
We use a value-and-momentum-driven approach to asset allocation because we believe that:
- Simple valuation metrics like the Cyclically-Adjusted Earnings Yield of a broad equity market are robust predictors of the market’s long-term expected real return,
- Momentum is a good medium-term predictor because investors have a tendency to extrapolate future market returns from recent historical samples, which results in trends generated by “return chasing” behavior, and
- Value and momentum signals often yield offsetting recommendations, which makes them more effective when used together than individually.
We are attracted to broadly diversified, rules-based investing which index products tend to facilitate, and to the cost and tax efficiency of index products. One of our core principles is to focus on costs, and you can see our note [here](https://elmwealth.com/a-penny-saved-is-two-pennies-earned/) on why we think reducing costs is even more important than meets the eye to maximizing investor risk-adjusted returns.
### Methodology
We start by constructing an All-Equity Baseline portfolio intended to be more representative of the Global Market Portfolio than the adjusted-market-capitalization indexes of MSCI and FTSE, with a moderate “home bias” preference for OECD non-US investors. The process is the same as applied to constructing our Global Balanced Baseline, except in the All-Equity Baseline we put a 0% weight on fixed income assets.
The next step is to determine, at each portfolio rebalancing date, desired deviations from the Baseline weight of each asset bucket using a combination of a valuation metric and a momentum indicator. This is also done largely in the same way as we do for our Global Balanced program, with several modifications to fit the context of an All-Equity portfolio. Most significantly, we normalize the target weights so that they always sum to 100%, and we also impose a constraint that no bucket’s target weight can be more than twice its Baseline weight.[4](https://insights.elmwealth.com/elm-wealth-research/page/4#easy-footnote-bottom-4-3287) We measure momentum for each asset class relative to the return of the Baseline[5](https://insights.elmwealth.com/elm-wealth-research/page/4#easy-footnote-bottom-5-3287) and we’ve reduced the intensity of the value signal to counter the amplification which can result from the target weight normalization process.[6](https://insights.elmwealth.com/elm-wealth-research/page/4#easy-footnote-bottom-6-3287)
The table below shows the Baseline weights and the desired targets as of March 31, 2020.
You can find more detail on our Baseline construction and value and momentum overlay [here.](https://elmwealth.com/our-asset-allocation-methodology/)
### Implementation
We will manage EPAEP using Elm’s proprietary Ulmus portfolio management system, and will rebalance the portfolio twice monthly. We expect portfolios to have weighted average expense ratios (excluding Elm’s 0.12% pa management fee) in the range of 0.10 to 0.12% per annum, and over time we expect ETF fees to decrease even further. The table below shows a sample of the instruments we intend to use to build the Fund’s portfolio, though many more instruments are in our database for consideration and possible use.
The Fund has monthly liquidity, on the last business day of each month with at least 3 business days notice.
### Historical Simulation
As usual, we stress that historical data on its own is not sufficient to establish that an investment strategy such as the one outlined in this note is a good one. We are firm believers that past returns are not indicative of future performance. However, history can lead us to conclude that a strategy is poor, and it is with that perspective that we look to the past.
The chart below shows a simulated back-test from December 31, 1974[7](https://insights.elmwealth.com/elm-wealth-research/page/4#easy-footnote-bottom-7-3287) to September 30, 2018. Our All-Equity program’s dynamic value and momentum overlay added 1.3% pa of extra return with no material increase in volatility, sampled monthly, versus the returns of a static weight All-Equity Baseline portfolio. This is in line with what we would have expected given that the value and momentum overlay applied to the Global Balanced Baseline increased returns by 2.7% a year with no material increase in volatility over roughly the same historical period, as we reported in our 2016 Journal of Portfolio Management [paper.](https://elmwealth.com/wp-content/uploads/2017/06/A-Case-Study-for-Using-Value-and-Momentum-at-the-Asset-Class-Level.pdf) This makes sense as the Global Balanced portfolio has more flexibility to vary its asset allocation compared to the All-Equity program.
The variability of the difference in returns between the dynamic and static All-Equity portfolios was 1.9% pa, sampled monthly, suggesting a Sharpe Ratio for the dynamic versus static strategy of 0.7 over the full period. This is consistent with the finding that the value and momentum overlay resulted in outperformance 60% of the time to a monthly horizon. However, as we’d expect, to a longer-term horizon of five years the outperformance was more consistent, occurring in 97% of 466 rolling five-year periods evaluated at the end of each month. This is shown in the chart below.
The final chart shows the simulated historical desired asset allocation of the dynamic value and momentum asset allocation. Portfolio turnover over the period averaged 60% per annum. In practice we expect lower turnover, as rebalancing would be every 40 days rather than monthly and we generally do not rebalance every bucket back to its exact desired weight.
### Back-test Assumptions and Details
In order to simulate returns from 1975, we had to make a number of simplifications to the strategy owing to some data not being available over the entire history. Going forward, we would update the Baseline weights annually, but in this back-test we have kept them fixed at today’s Baseline weights. However, we do not think this has a material effect on the performance of the value and momentum dynamic overlay relative to the Baseline. Also due to limitations of the available data, the buckets we’ve used for the back-test are not a perfect match of the buckets we will divide the portfolio into going forward. For example, the back-test does not include some buckets that we intend to use in the program in the future, such as low Price/Book and small cap buckets, and on the other hand the back-test has a more granular split than we intend to use going forward, with Europe split into Europe x-UK and UK and Developed Asia split into Developed Asia x-Japan and Japan. Return figures include a 0.3% per annum reduction in the dynamic All-Equity strategy for transactions costs, fees and non-recoverable foreign withholding taxes, 0.2% for the static Baseline and 0.15% for the MSCI All Country World index to May 31, 2008, and afterwards we use the total return of the iShares ETF ACWI. We assumed rebalancing back to target each month-end rather than every 40 days. We used the same Cyclically-Adjusted Earnings Yield centering point of 6% for all regional equity markets. In most other details, we generally made choices that would make the back-test consistent with how we have implemented our Global Balanced strategies.
We stress again that this historical data should not, by itself, be the basis for making an investment decision. The results suggest that an All-Equity program like we’ve conceived has been historically sensible. Still, the All-Equity program is primarily designed for investors who already like this style of investing on principle and would like Elm to provide a sophisticated and efficient implementation.
### Finally…
Please be in touch with any questions or suggestions. You can request a short presentation and fund Prospectus [here.](mailto:info@elmwealth.com)
---
### Note:
This is not an offering document. **Past returns not indicative of future returns.** The value of an investment and the income from it can fall as well as rise and you may not get back the amount originally invested.
---
### Further Reading and References:
- Asness, C.S., T. J. Moskowitz, and L. Pedersen. “Value and Momentum Everywhere,” Journal of Finance, Vol. 68, No. 3 (2013), pp. 929-986.
- Blitz, D., and P. van Vliet. “Global Tactical Cross-Asset Allocation: Applying Value and Momentum Across Asset Classes,” The Journal of Portfolio Management, Vol. 35, No. 1 (2008),
pp. 23-38.
- Campbell, J., and R. Shiller. “The Dividend-Price ratio and Expectations of Future Dividends and Discount Factors.” Review of Financial Studies, 1 (1988), pp. 195-228.
- Cochrane, J. “The Dog That Did Not Bark: A Defense of Return Predictability.” Review of Financial Studies, Vol. 21, No. 4 (2008), pp. 1533-1575.
- De Grauwe, P., and M. Grimaldi. “Bubbling and Crashing Exchange Rates.” Working Paper, CESifo (Series No. 1045), 2003.
- Dewey, R., and Haghani, V. “A Case Study for Using Value and Momentum at the Asset Class Level.” Journal of Portfolio Management, volume 42 number 3, (Spring 2016).
- Fama, E.F., and K.R. French. “Business Conditions and Expected Returns on Stocks and Bonds,” Journal of Financial Economics, 33 (1989), pp. 25-49.
- Fama, E.F., and K.R. French. “Dissecting Anomalies.” Journal of Finance, 63 (2008), p. 1653-1678.
- Ferson, W. E., and C. Harvey. “The Variation of Economic Risk Premiums.” Journal of Political Economy, Vol. 99, No. 2 (1991), pp. 385-415.
- Gnedenko, B., and I. Yelnik. “Dynamic Risk Allocation with Carry, Value and Momentum.” Working paper, ADG Capital Management LLP, 2014.
- Jegadeesh, N., and S. Titman. “Returns to Buying Winners and Selling Losers: Implications for Stock Market Efficiency.” Journal of Finance, Vol. 48, No. 1 (1993), pp. 65-91.
- Kahneman, D., and A. Tversky. “Judgment Under Uncertainty: Heuristics and Biases.” Science, Vol. 185, No. 4157 (1974), pp. 1124-1131.
- Moskowitz, T.J., Y.H. Ooi, and L.H. Pedersen. “Time Series Momentum.” Journal of Financial Economics, Vol. 104, No. 2 (2012), pp. 228-250.
- Pirrong, C. “Momentum in Futures Markets.” Working paper, University of Houston, 2005.
- Soros, G. The Alchemy of Finance. New York, NY: Simon and Schuster, 1988.
- Wang, P., and L. Kochard. “Using a Z-score Approach to Combine Value and Momentum in Tactical Asset Allocation.” Working paper, Georgetown University Investment Office, 2011.
---
1. This not is not an offer or solicitation to invest, nor should this be construed in any way as tax advice. **Past returns are not indicative of future performance.**
2. See our notes [here](https://elmwealth.com/how-much-of-a-good-thing-is-best-for-you/) and [here](https://elmwealth.com/a-sharper-lens-for-sizing-up-nickels-and-steamrollers/) for a deeper discussion of this body of work.
3. A working paper version of Value and Momentum Everywhere, Asness, Moskowitz and Pedersen, was in circulation from 2009 SSRN [here](https://papers.ssrn.com/sol3/papers.cfm?abstract_id=1363476), and presented at the 2010 AFA meeting, although the paper only appeared in the Journal of Finance in 2013.. You can find a copy of our paper [here.](https://elmwealth.com/wp-content/uploads/2017/06/A-Case-Study-for-Using-Value-and-Momentum-at-the-Asset-Class-Level.pdf)
4. To normalize the target weights to 100% and impose the 2x constraint we iteratively impose the constraint and re-normalize until both the normalizing condition and the constraint are fully satisfied.
5. This is also consistent with the treatment of momentum signals in this early paper on implementing value and momentum in an asset allocation context: Blitz and Van Vliet, “[Global Tactical Cross-Asset Allocation: Applying Value and Momentum Across Asset Classes,](https://papers.ssrn.com/sol3/papers.cfm?abstract_id=1079975)” Journal of Portfolio Management (2008).
6. We set the slope of the value signal in the All-Equity program to 0.5, in contrast to 1 in our Global Balanced programs.
7. Many of the historical data series we need for this analysis begin December 31, 1974, particularly the MSCI data series for regional equity market total returns and earnings.
[James White](https://insights.elmwealth.com/elm-wealth-research/author/james-white)
[Read More](https://insights.elmwealth.com/elm-wealth-research/epaep)
[2](https://insights.elmwealth.com/elm-wealth-research/page/2) [3](https://insights.elmwealth.com/elm-wealth-research/page/3) [4](https://insights.elmwealth.com/elm-wealth-research/page/4) [5](https://insights.elmwealth.com/elm-wealth-research/page/5) [6](https://insights.elmwealth.com/elm-wealth-research/page/6)